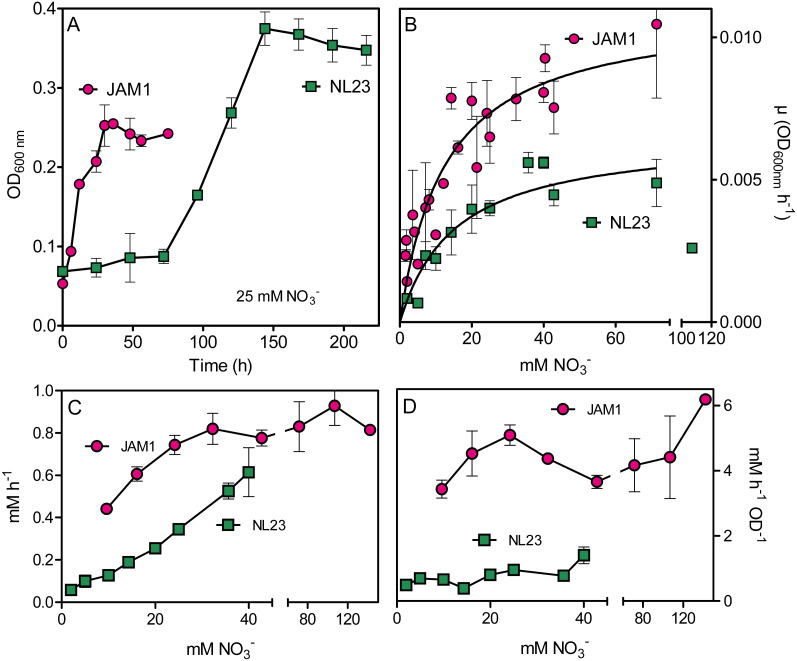
Figure 1. Growth and NO reduction in planktonic mono-cultures.
(A) Growth under planktonic anoxic conditions with 25 mM NO and 0.3% methanol at 30 °C. (triplicate cultures). (B and C) Growth rates and NO reduction rates, respectively, at different NO concentrations. The curves in (B) are derived from non-fit linear regression; the growth rates at 107 mM in the strain NL23 cultures were not included. Each point is the average of three to eight replicate anoxic cultures. (D) Specific NO reduction rates. These rates were calculated with the NO reduction rates by the generated culture biomass (OD600 nm) at the end of the exponential phase. Each point represents data from triplicate cultures. Data for strain JAM1 in C and D were taken from Geoffroy et al. (2018).

