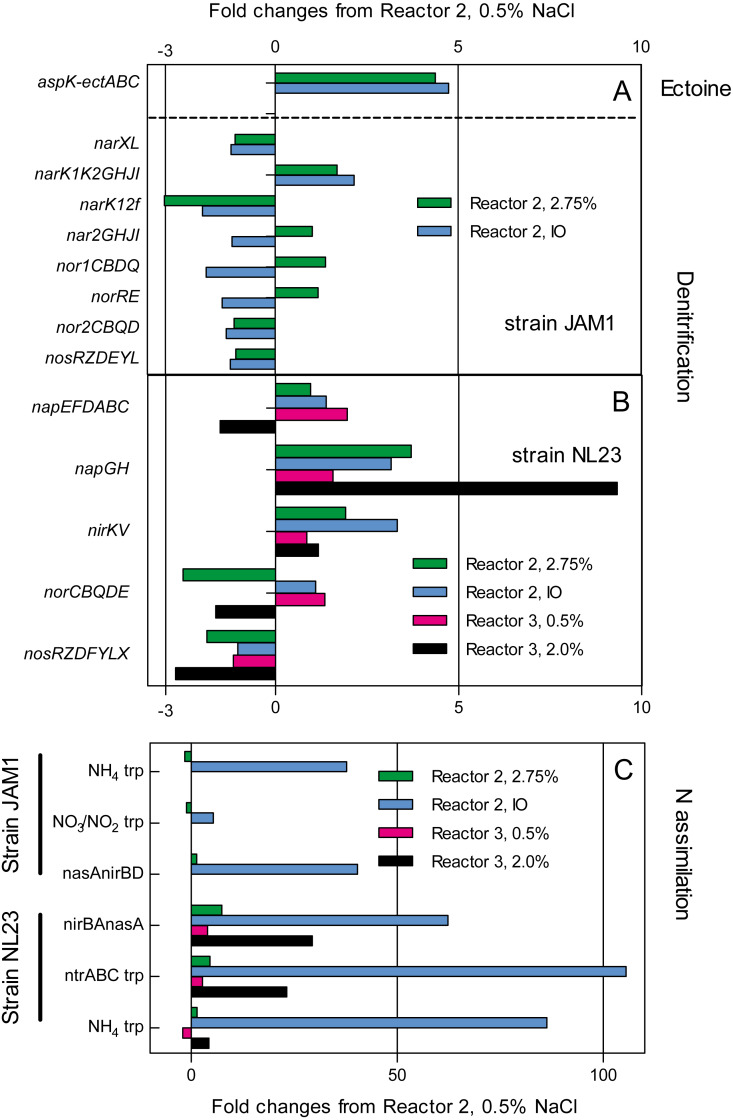
Figure 4. Changes in the relative transcript levels of genes involved in the denitrification and N-assimilation pathways, and in ectoine synthesis.
Total RNA was extracted from the biofilm samples taken from the reactors 2 and 3 operated at the different conditions. RNA samples were sequenced, and the reads associated to the denitrification genes (A and B), the N-assimilation genes (C) and ectoine genes (A) were transformed in transcripts per million (TPM). The TPM values of each gene operon were compared to those of the reactor 2, 0.5% NaCl, which was set to 1.0.

