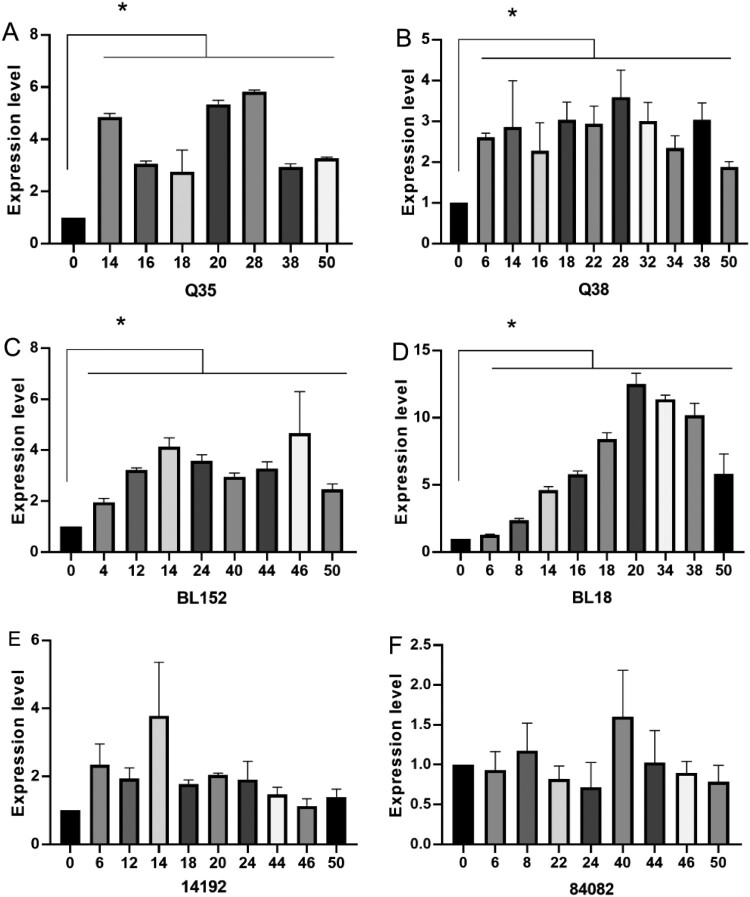
Figure 1.
The blaKPC expression levels in strains without mutations in KPC. The horizontal axis is the number of passages of induction. The vertical axis is the relative expression level compared to the strain before induction (expression = 1.0). The housekeeping gene rpoB was used as the endogenous reference gene. All RT-qPCR were carried out in triplicate. *P < 0.05 (Student’s t-tests).

