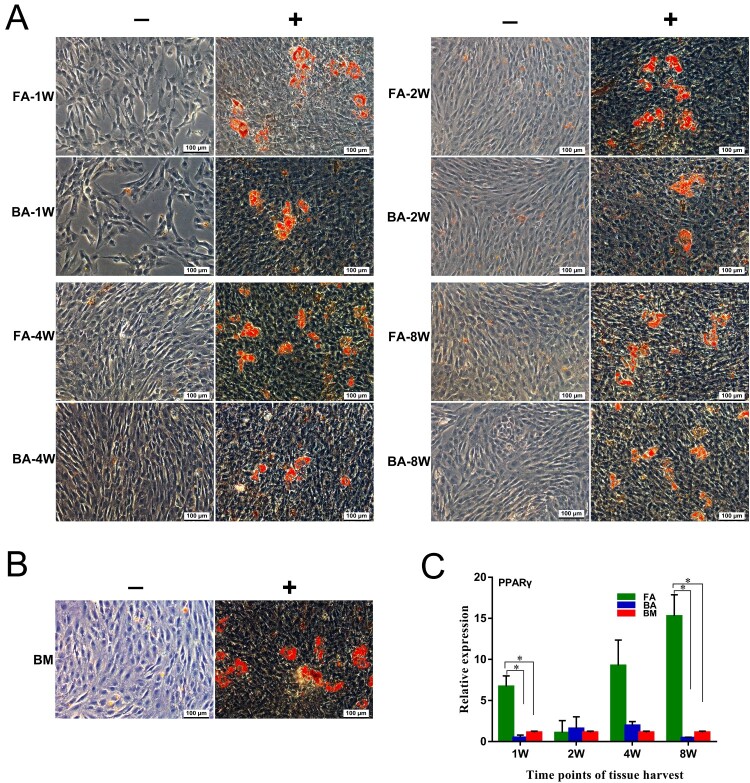
Figure 8.
Adipogenic differentiation capabilities of the nine groups of MSCs. (A) and (B) MSCs are cultured for 21 days in non-differentiation control (−) and adipogenic differentiation media (+). The presence of adipocytes was assessed by detection of lipid drops using Oil Red O stain. Scale bar: 100 μm. (C) Quantitative real-time polymerase chain reaction measurements of the expression levels of the adipogenic marker PPARγ. mRNA levels were measured in three independent samples (n = 3). Data are expressed as mean ± standard deviation. *P < .05. FA, fibrous ankylosis; BA, bony ankylosis; BM, bone marrow; MSCs, mesenchymal stromal cells.

