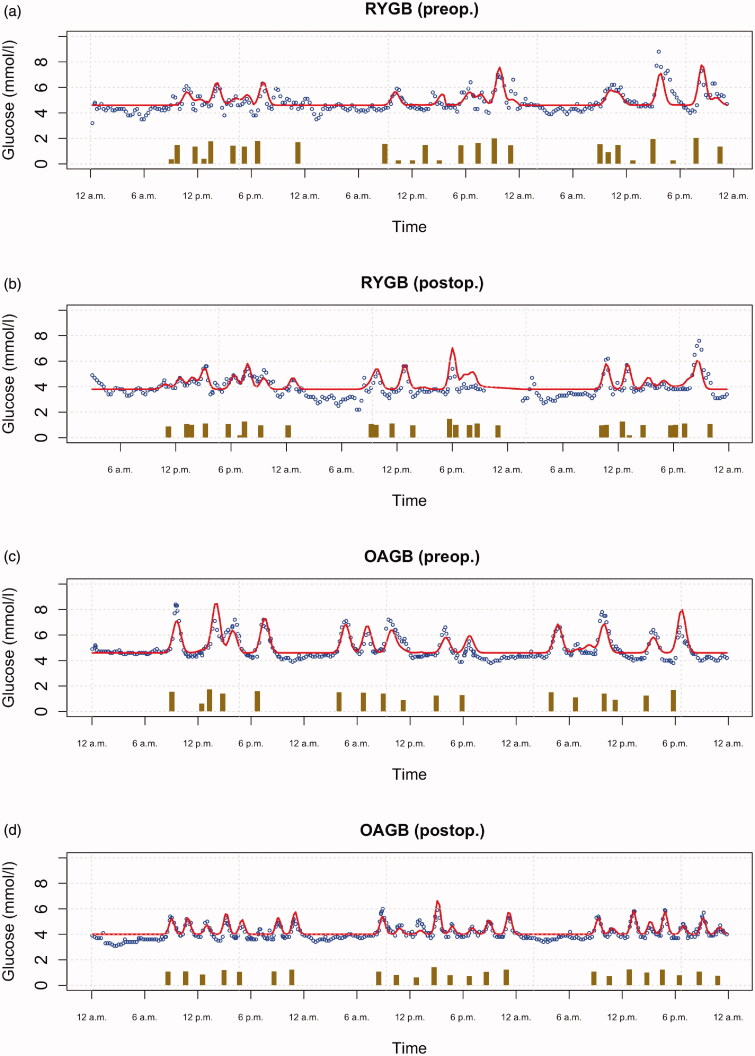
Figure 3.
Visualization of the 3-day preoperative time-series for two sample patients before and after the operations: (a) RYGB (preop); (b) RYGB (postop); (c) OAGB (preop); (d) OAGB (postop). Dots are the measurements of glucose concentration. Reported carbohydrate intake, on logarithmic scale, in each meal is indicated by vertical bars. The curves show the fitted models that allow estimating the impact of carbohydrate intake on the glucose level (i.e. how the height and width of the glucose response in the curve depend on the height of the corresponding bar). RYGB: Roux-en-Y gastric bypass surgery; OAGB: one-anastomosis gastric bypass surgery.

