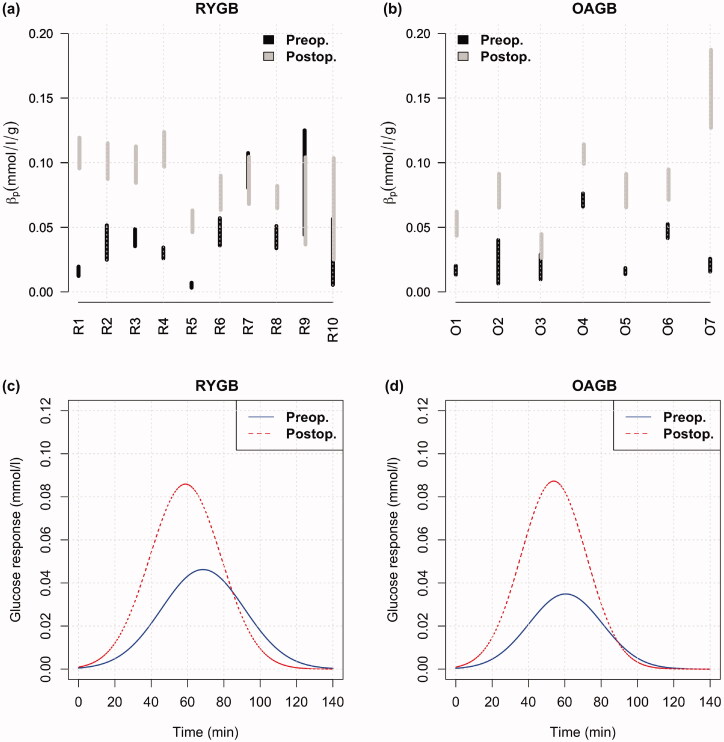
Figure 4.
95% confidence interval for the βp parameter for each patient before and after the surgery in (a) RYGB and in (b) OAGB. This parameter indicates the increase in the height of the glucose response curve (the dotted curve in Figure 3) when the amount of dietary carbohydrates increases by one unit (g). Evident in the figure, same amount of carbohydrates causes a higher rise in the glucose concentration in almost all cases after the operation. RYGB: Roux-en-Y gastric bypass surgery; OAGB: one-anastomosis gastric bypass surgery. Average glucose responses to one gram of carbohydrate intake in (c) RYGB and (d) OAGB.

