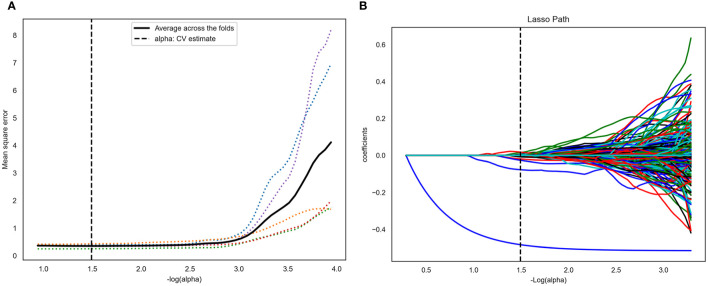
Figure 3.
Computed tomography (CT) image features selection using one-way analysis of variance (ANOVA) and the least absolute shrinkage and selection operator (LASSO) logistic regression model in the training set. (A) The five-fold cross-validation and the minimal criteria process was used to generate the optimal penalization coefficient lambda (λ) in the LASSO model. The vertical line defines the optimal values of λ, where the model provides its best fit to the data. The optimal λ value of 0.165 with -log (λ) =1.5 was selected. (B) LASSO coefficient profiles of the radiomics features. The vertical line was drawn at the value selected using five-fold cross-validation, where optimal λ resulted in 14 nonzero coefficients.

