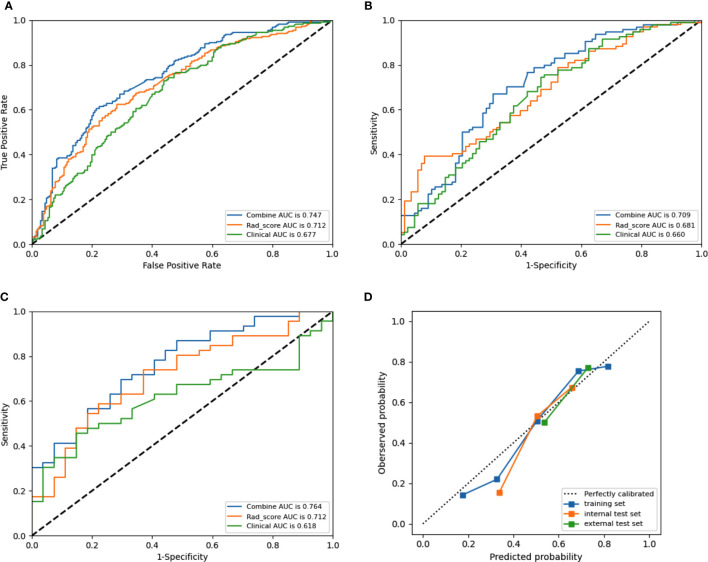
Figure 6.
Receiver operating characteristic (ROC) curves of the combined model (blue lines), Rad-score model (orange lines) and clinical model (green lines) in the training set (A), internal test set (B) set, and external test set (C), respectively. Calibration curves (D) of the combined model in the training and test sets, respectively. The diagonal dotted line represents an ideal prediction, while the red line represents the performance of the training set, the blue line and black line represents the performance of the internal test set and external test set, respectively, Closer fit to the diagonal dotted line indicates a better prediction.

