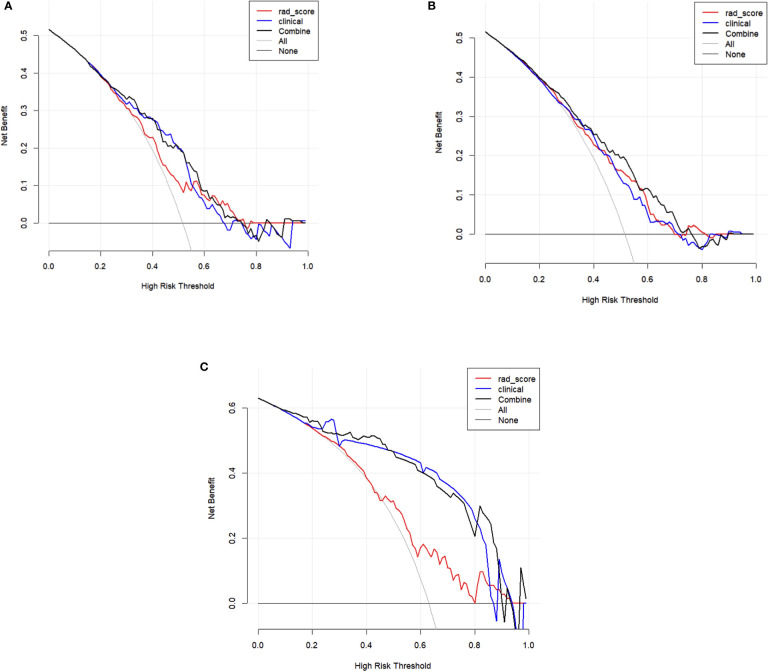
Figure 7.
Decision curve analysis (DCA) of training set (A), internal test set (B), and external test set (C). The y-axis measures the net benefit. The x-axis shows the corresponding risk threshold. The grey line represents the assumption that all lesions were central lymph node metastases. The black straight line represents the assumption that all nodules were non-CLNM. If the threshold probability was more than 30%, using the combined model (black line) to predict CLNM added more benefit than the Rad-score model (red line) and clinical model (blue line) in the internal test set; If the threshold probability was more than 10%, using the combined model (black line) to predict CLNM added more benefit than the Rad-score model (red line) and clinical model (blue line) in the external test set.

