
Figure 4 .
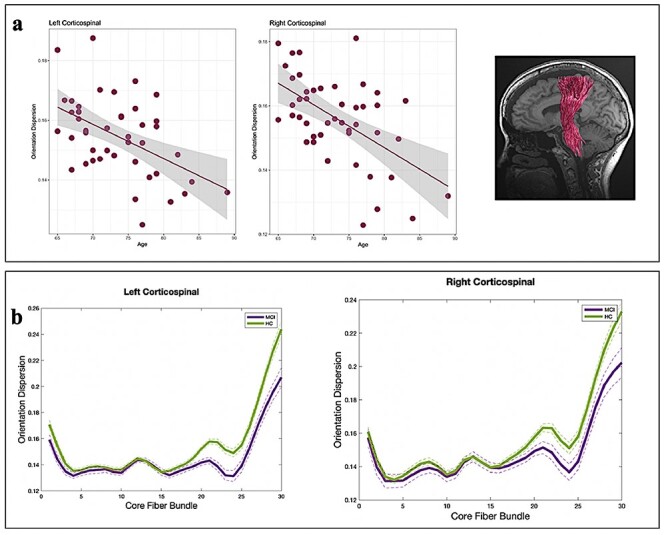
(a) Age associations in neurite orientation dispersion (ODI) in the corticospinal tracts (CST). The solid line denotes the linear regression line, and the width of the grey shade area denotes the 95% confidence interval. (b) ODI measurements in HC and aMCI in the right and left CST. Each solid line represents the group average for ODI, and dotted lines indicate standard error of the mean.