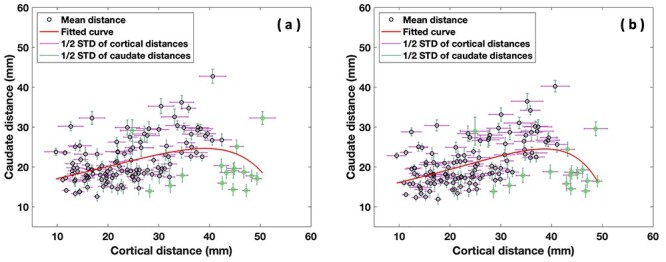
Figure 4 .

Scatter plots of the 17 fiber clusters per hemisphere (with 136 pairs of fiber clusters, yielding 136 data points) that connect the prefrontal cortex and the caudate, showing a nonlinear relationship between cortical and caudate intercluster streamline endpoint distances in the left, (a), and right, (b), hemispheres. The green circles represent all 16 cluster pairs with cluster 6 included as one of the cluster pair. Note, the 10 green circles located in the lower right portion of the scatter plot below and on the fitted curve drive the nonlinearity of the fitted curve.
