
Figure 1 .
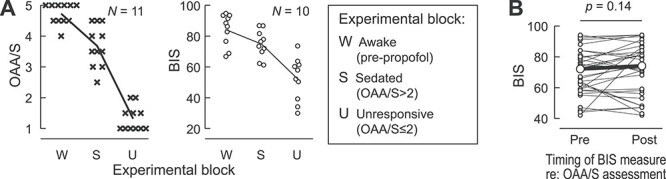
Assessment of arousal during induction of general anesthesia. (A) Summary of data from 11 subjects. Observer’s Assessment of Alertness/Sedation (OAA/S) scores (left panel, crosses) and bispectral index (BIS) values (right panel, open circles) are plotted for each subject for three experimental blocks corresponding to the three studied arousal states (W: awake, S: sedated, U: unresponsive). OAA/S scores represent average values of the two scores, obtained immediately before and after each block. BIS values are averages of minute-by-minute measurements within each 11-min block. Lines represent across-subject mean values. See Supplementary Figure 1 for time courses of induction of general anesthesia in each subject. (B) Comparison of BIS values recorded immediately before and after OAA/S assessments (38 pairs in 10 subjects) that were used to define S and U blocks. Smaller symbols represent individual BIS measurements; larger symbols represent median pre- and postassessment BIS values. Data from subject R369 are not included in the right plot of panel A and in panel B, as depth of anesthesia was assessed using response entropy rather than BIS in this subject.