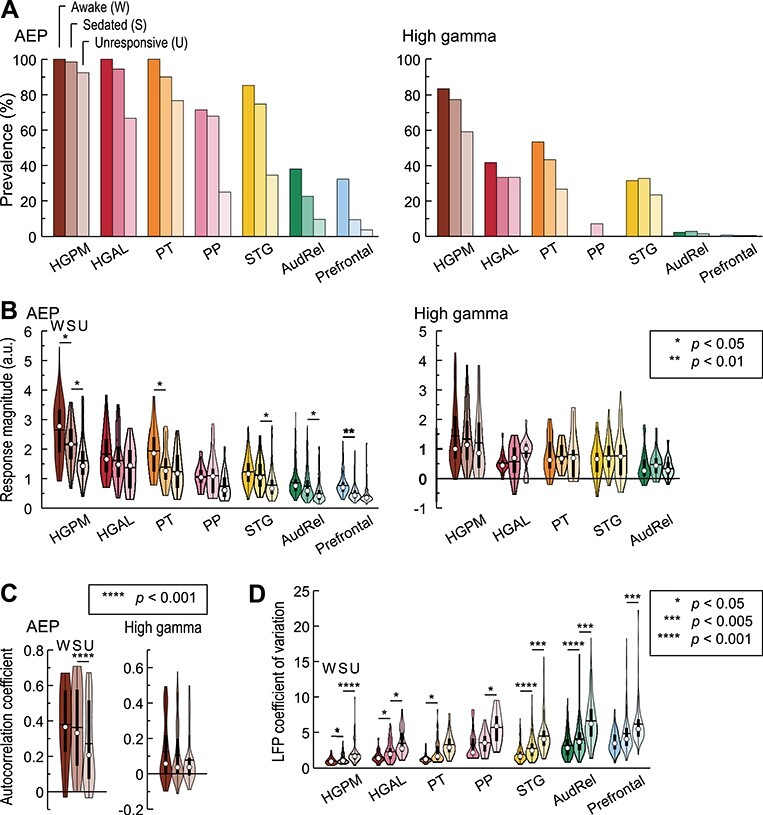
Figure 4 .

Anesthetic effects on cortical responses to vowels. Summary of data from all 11 subjects. Colors represent ROIs, differently shaded bars and symbols represent measurements made in awake, sedated, and unresponsive state (dark, medium, and light, respectively). Significant W → S and S → U contrasts identified by LME models for magnitude and EFR are labeled with stars; differences that did not reach significance at P = 0.05 are not labeled. (A) Percentages of sites with significant AEPs and high gamma responses (left and right panels, respectively). (B) Magnitude of AEP and high gamma responses (left and right panels, respectively). In each violin plot, white circle denotes the median, horizontal line denotes the mean, bar denotes Q1 and Q3, and whiskers show the range of lower and higher adjacent values (i.e., values within 1.5 interquartile ranges below Q1 or above Q3, respectively). (C) AEP and high gamma (left and right panels, respectively) EFRs in HGPM. (D) LFP coefficient of variation. AEP, averaged evoked potential, HGPM, posteromedial portion of Heschl’s gyrus; HGAL, anterolateral portion of Heschl’s gyrus; PT, planum temporale; PP, planum polare; STG, superior temporal gyrus; AudRel, auditory-related cortex. In panels B, C and D, sites that exhibited significant responses in any of the three arousal states were examined; ROIs with fewer than 10 such sites were not included. See Supplementary Table 1 for results of LME model analysis.
