Figure 3.

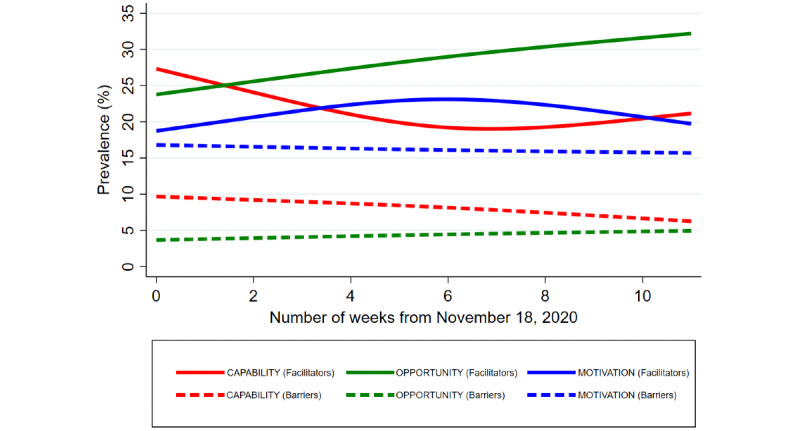
Temporal variations in the prevalence of the barriers and facilitators related to each component in the COM-B model. The graph was plotted using restricted cubic spline smoothing.

Temporal variations in the prevalence of the barriers and facilitators related to each component in the COM-B model. The graph was plotted using restricted cubic spline smoothing.