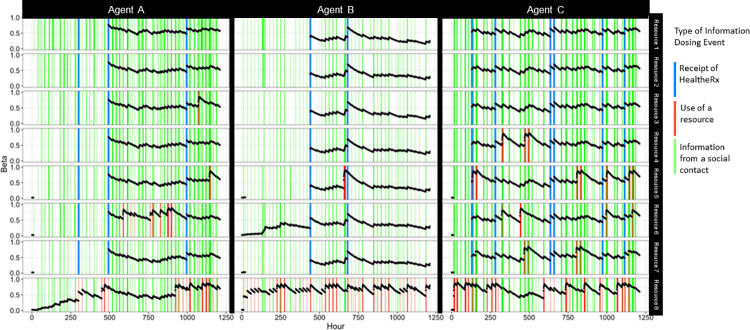
Fig 5. Exemplar instance of the evolution of three agents’ knowledge (Beta, β) of eight resources over time (λ of 0.991 used in this instance based on sensitivity analysis and model calibration previously reported in [39]); Chicago, IL 2016–2018.
Note: Each column (n = 3) represents a unique agent. Each row represents a unique resource (n = 8). Each black dot indicates the β scores (left y-axis) at in point in time in hours (bottom x-axis). Information dosing events (receipt of information about a given resource) that occurred during a given hour are indicated by vertical lines as: receipt of a HealtheRx (blue), receipt of information about resources from a social contact (green) and use of a resource (red).

