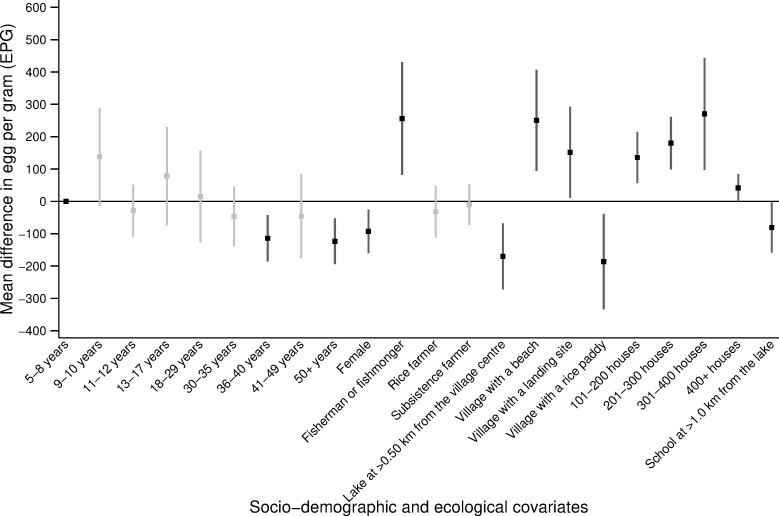
Fig 4. Predictors of the S. mansoni age-related infection intensity.
Average change in eggs per gram (EPG), with the corresponding 95% confidence intervals (CI) from the negative binomial regression presented in S5 Table in S1 File. Only covariates that were chosen through likelihood ratio tests are shown in the figure. The black squares (lines) represent the average change in EPG (95% CI) for the statistically significant covariates (p-value≤0.05). The grey squares (lines) represent the average change in EPG (95% CI) for the non-statistically significant (p-value>0.05) covariates. Note: only four villages have 400+ houses.

