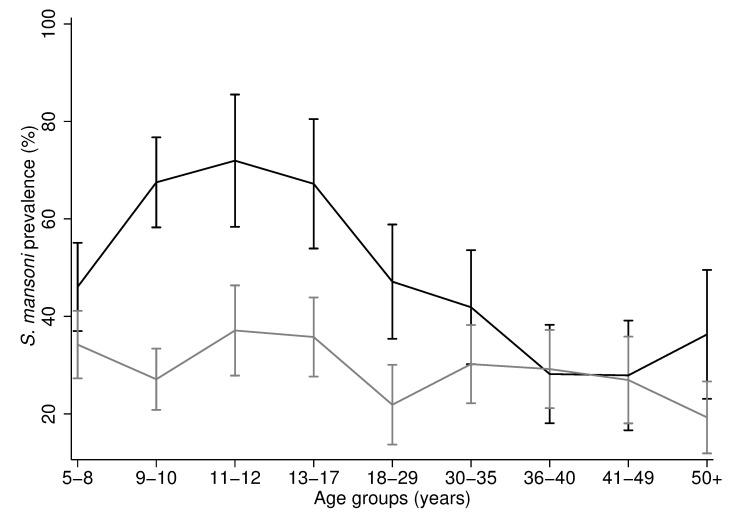
Fig 5. Interaction between age and distance from the village to Lake Victoria against infection status.
The black line represents the infection prevalence across age groups for individuals located at a distance ≤0.50km from Lake Victoria. The grey line represents the S. mansoni infection prevalence for individuals located at a distance ≥0.50km from Lake Victoria. 95% confidence intervals are shown.

