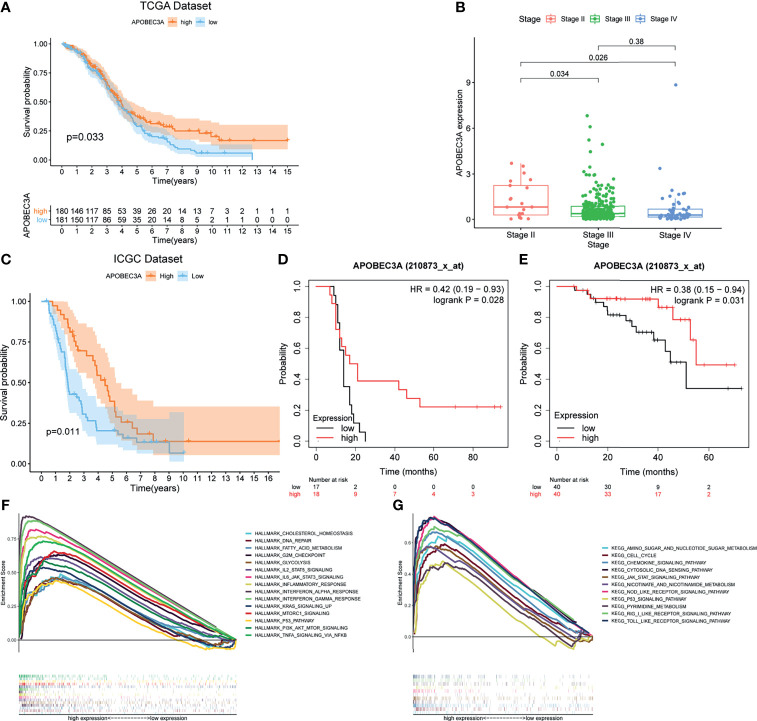
Figure 3.
Correlation analysis of APOBEC3A expression with survival and clinicopathological staging characteristics of ovarian cancer (OC) patients. (A) Survival analysis for OC patients with different APOBEC3A expression. Patients were marked with high expression or low expression depending on comparing with the median expression level. p = 0.033 by log-rank test. (B) The correlation of APOBEC3A expression with clinicopathological stage characteristics. Kruskal–Wallis rank sum test acted as the statistical significance test. (C) The correlation of APOBEC3A expression with survival time from the International Cancer Genome Consortium (ICGC) database in OC patients, by log-rank test. (D, E) The correlation of APOBEC3A expression with survival time using the Kaplan–Meier plotter. (F, G) Enriched gene sets in the HALLMARK and KEGG gene sets, by samples of high APOBEC3A expression. Each line is represented by one particular gene set with unique color, and upregulated genes are located on the left, which approach the origin of the coordinates; by contrast, the downregulated ones lay on the right of the x-axis. Only gene sets with both NOM p < 0.05 and FDR q < 0.05 were considered significant. Only several top gene sets are shown in the plot.

