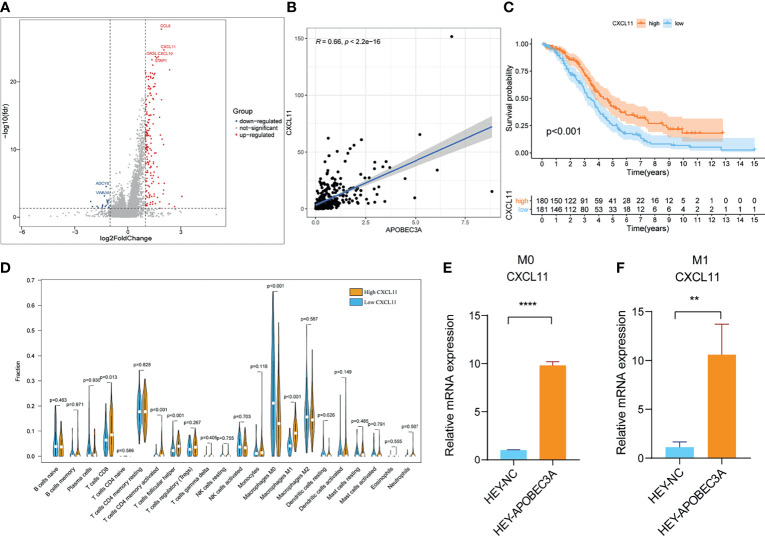
Figure 5.
Analyses of APOBEC3A high- and low-expression cohorts in ovarian cancer (OC) patients. (A) Volcano plot for differentially expressed genes (DEGs). The blue and red dots represented the significantly downregulated and upregulated genes, respectively, and the gray dots represented the genes without differential expression. FDR < 0.05,|log2 FC|> 1, and p < 0.05. (B) The correlation analysis of APOBEC3A expression with CXCL11 expression. (C) Kaplan–Meier curve shows the independent relevance between overall survival time and CXCL11 expression. (D) Violin plot showed the ratio differentiation of 22 types of immune cells between OC tumor samples with high or low expression relative to the median of CXCL11 expression, and Wilcoxon rank sum was applied for the significance test. (E, F) RT-qPCR showed that APOBEC3A was positively correlated with CXCL11 in Macrophage M0 (E) and M1 (F). All **p < 0.01, ****p < 0.0001; the data represent the mean ± SD from triplicate measurements.

