Figure 6.
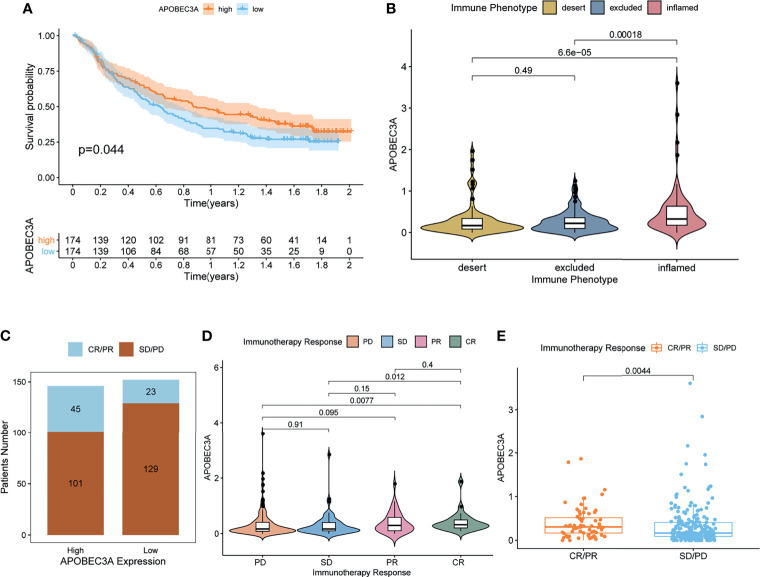
APOBEC3A in the role of anti-PD-L1 immunotherapy. (A) Survival analyses for high (174 cases) and low (174 cases) APOBEC3A expression patient groups in the anti-PD-L1 immunotherapy cohort using Kaplan–Meier curves (IMvigor210 cohort; p = 0.044, Log-rank test). (B) Differences in APOBEC3A among distinct tumor immune phenotypes in the IMvigor210 cohort. The lines in the boxes represented median value (by Kruskal–Wallis test). (C) The number of patients with response to PD-L1 blockade immunotherapy in high or low APOBEC3A expression groups. SD, stable disease; PD, progressive disease; CR, complete response; PR, partial response. Responser/Nonresponer: 45/101 in the high APOBEC3A expression groups and 23/129 in the low APOBEC3A expression groups. (D) Distribution of APOBEC3A in distinct anti-PD-L1 clinical response groups. (E) The correlation of APOBEC3A with immunotherapy response, Wilcoxon rank sum was applied for the significance test.

