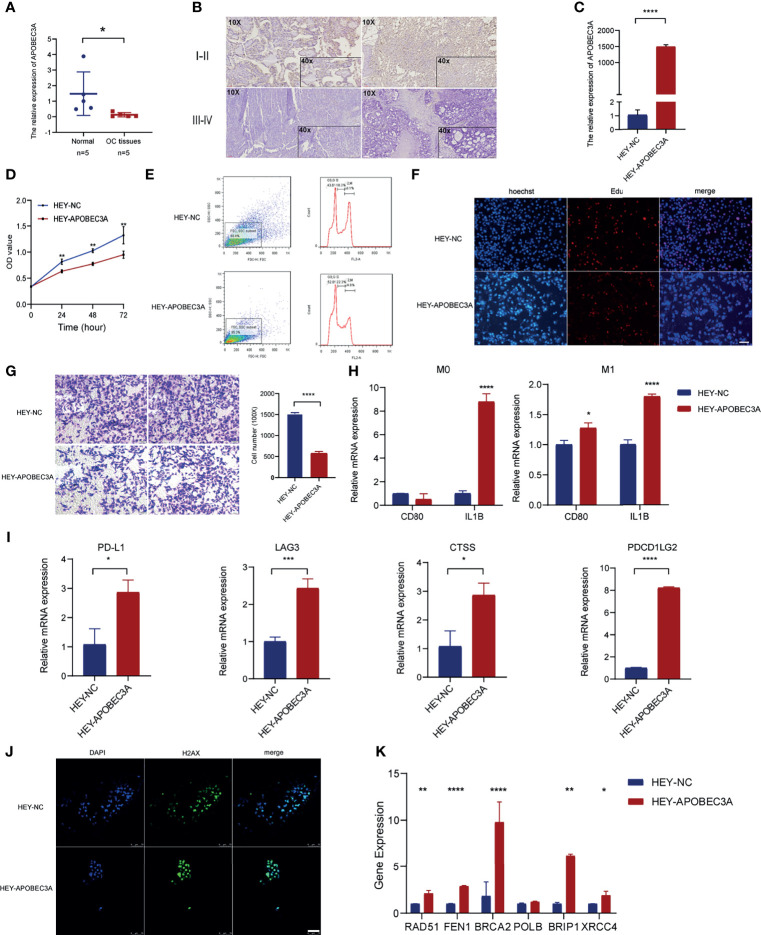
Figure 8.
Functional verification of APOBEC3A in ovarian cancer (OC) cells. (A) The mRNA level of APOBEC3A in five OC tissues and five normal ovarian tissues. (B) The expression of APOBEC3A protein in I–II stage and III–IV stage OC tissues was detected by IHC (magnification ×100 and ×400). (C) The transfection efficiency of APOBEC3A was verified in HEY cells by RT-qPCR. (D) APOBEC3A-reduced proliferation rate of HEY cells by CCK-8. (E) Flow cytometry analysis showed overexpression of APOBEC3A enhanced HEY cell cycle arrest. APOBEC3A increased the percentage in the G0/G2 phase compared with HEY-NC cells. (F) EdU assay showed that the proliferative ability of HEY cells was inhibited by APOBEC3A. Nuclei are shown in blue (Hoechst) (magnification ×100) (G) Transwell assay showed cell migration ability of HEY cells was inhibited by APOBEC3A compared with HEY-NC cells. Bar equals 100 µm. (H) Co-culture assay showed APOBEC3A overexpressed in HEY promoted the expression of M1 markers (CD80 and IL1B) in macrophages (M0 and M1). (I) RT-qPCR showed that APOBEC3A was positively correlated with PD-L1, LAG3, CTSS, and PDCD1LG2. (J) H2Ax immunofluorescence showed that DNA damage foci formation was increased in HEY-APOBEC3A cells. Nuclei are shown in blue (DAPI). Green: H2Ax foci. Bar equals 75 µm. (K) RT-qPCR showed that APOBEC3A was positively correlated with RAD51, FEN1, BRCA2, BRIP1, and XRCC4. All *p < 0.05, **p < 0.01, ***p < 0.001, ****p < 0.0001; the data represent the mean ± SD from triplicate measurements.

