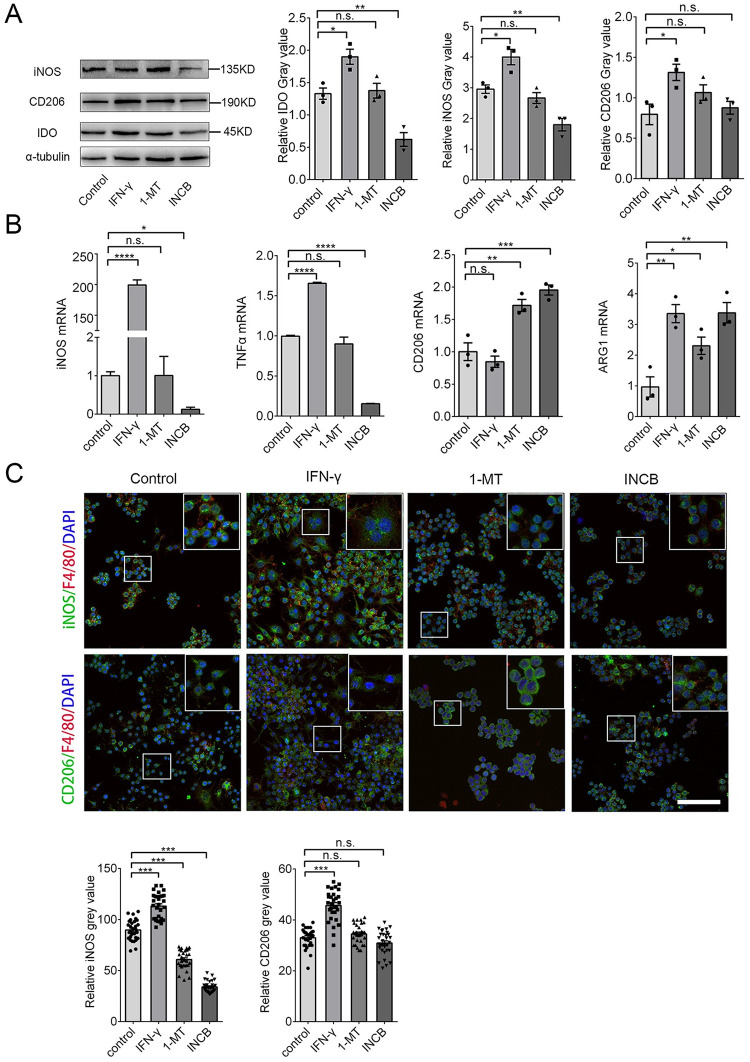
Fig 2. Inhibition of IDO-1 with 1-MT and INCB24360 decreased iNOS and TNF-α levels.
(A) The IDO-1, iNOS, and CD206 expression in RAW264.7 cells treated with IFN-γ, 1-MT or INCB24360 for 24 h. The relative intensity of IDO-1, iNOS, and CD206 in RAW264.7 cells as measured by ImageJ software. (B) The transcription levels of iNOS, TNFα, CD206 and Arg1 in RAW264.7 cells treated with IFN-γ, 1-MT or INCB24360 for 24 h. (C) The immunostaining images of iNOS and CD206 in RAW264.7 cells treated by IFN-γ, 1-MT or INCB24360 for 24 h. The relative intensity of iNOS or CD206 in RAW264.7 cells after treatment with IFN-γ, 1-MT or INCB24360, which was measured by ImageJ software. n≥30. Scale bars, 100 μm. One-way ANOVA; all data are expressed as the means ± SEM. *, P<0.05, **, P<0.01; ns, no significant difference.

