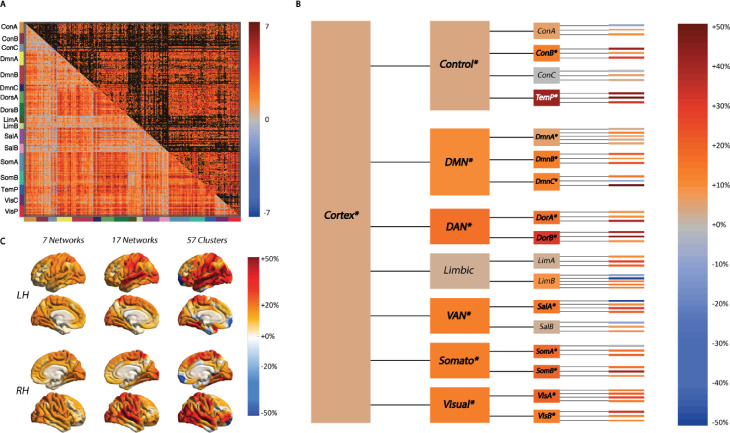
Fig 2. Changes in functional integration between large-scale cortical networks and regional clusters in the sleep-deprived state.
(A) The t test matrix of change in functional correlations between the time series of 400 cortical parcels (during task performance) depicts a widespread increase in correlations between SD and WR states (unthresholded, lower triangle; thresholded PFDR<0.05, upper triangle). (B) Changes in integration (as a percentage of the value in the WR condition) are shown across different levels of a hierarchical model of the cortex: whole cortex, 7 networks, 17 networks, and 57 clusters. The total integration within the cortex increased from the WR to the SD state, but not within all networks (*italics depict significant changes measured through a Bayesian framework). (C) The % change in total integration at each level of the hierarchy mapped onto the cortical surface illustrates that the increase in integration is most focused towards the centre of the lateral surface. Data underlying this figure can be found in S1 Data. DAN, dorsal attention network; DMN, default mode network; PFDR, positive false discovery rate; Somato, somatomotor network; VAN, ventral attention (salience) network; WR, well rested.

