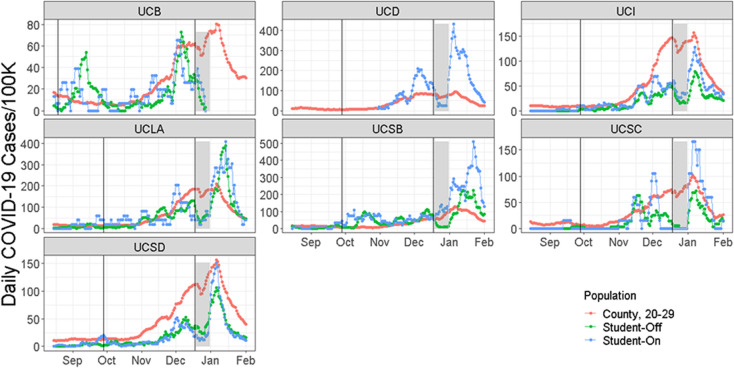
Fig 2. The 7-day running average of the daily number of people testing positive for SARS-CoV-2 per 100,000 individuals over time between August 15, 2020, and February 1, 2021.
Vertical lines show the start and end of the fall quarter or semester at these seven UC campuses, which is the period used for calculating the fraction of each population testing positive in Table 2. The grey bars show the winter break period when fewer students were on campus and being tested. For UCD, daily data were only available for asymptomatic testing of on-campus students and only after 10/27/20. For UCB data were available through 12/30/2020.

