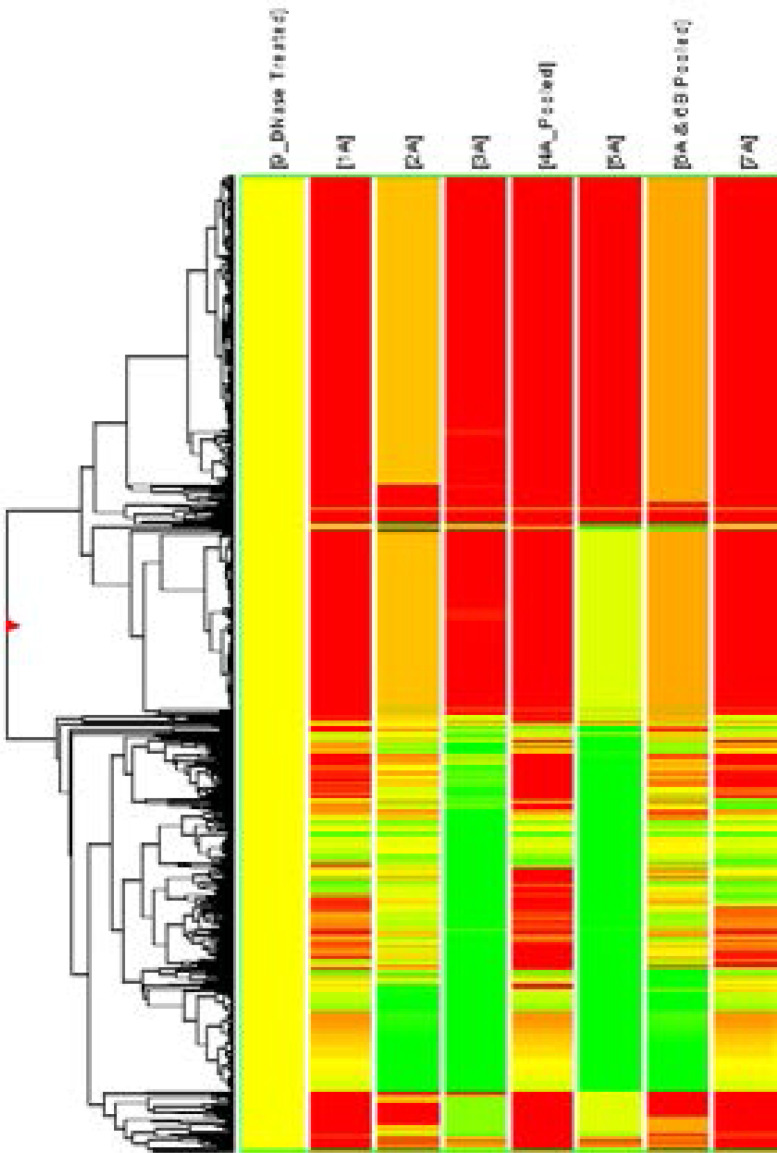
Fig. 1.
Heat map of microRNA (miRNA) microarray expression data from blood samples of Individuals with (n = 7) and without (n = 1) coronary artery calcification. Hierarchical clustering of miRNA is based on similar expression profiles in test vs. Control. Clustering analysis was performed using GeneSpringGX Software using Average Linkage rule with Pearson centered Distance Metric. Red color in the cluster indicates up regulation in test and green color in the cluster indicate down regulation in test compare to control. The Fold expression values represented in the cluster are in terms of log base 2.

