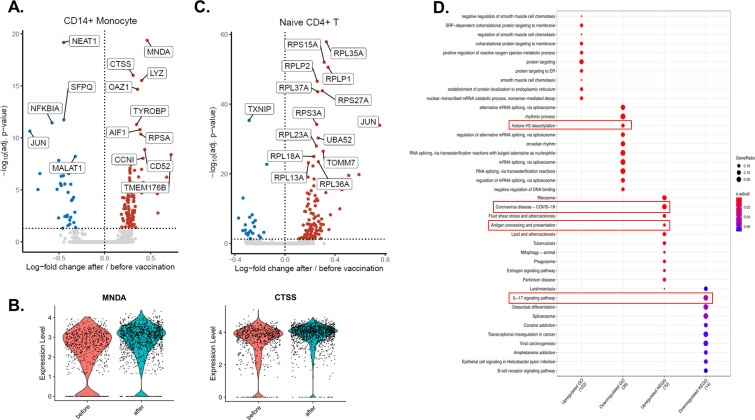
Fig 2. Transcriptomic changes induced by influenza vaccination on a single cell level.
A. Volcano plot depicting the upregulated and downregulated genes in CD14+ monocytes 6 weeks after influenza vaccination. Red dots show upregulation, while blue dots show downregulation. B. Violin plots showing the expression levels of MNDA and CTSS before and after vaccination in CD14+ monocytes. C. Volcano plot depicting the upregulated and downregulated genes in CD4+ naïve T cells 6 weeks after influenza vaccination. Significantly changing top 15 genes were labeled on the volcano plots. D. Pathway analysis of genes up-regulated or down-regulated by influenza vaccination.

