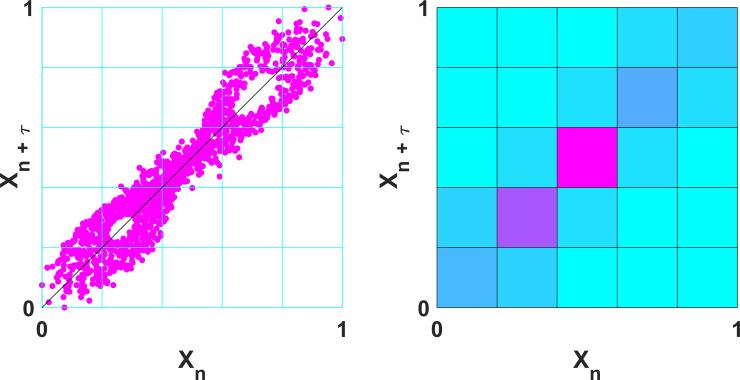
Fig 3. Poincaré plot and bivariate histogram returned by the gridded distribution entropy function (GridEn).
Representative Pioncaré plot and bivariate histogram of the x-component of the Lorenz system of equations (σ = 10, β = 8/3, ρ = 28), calculated with grid partitions (m) = 5 and a time-delay (τ) = 2.

