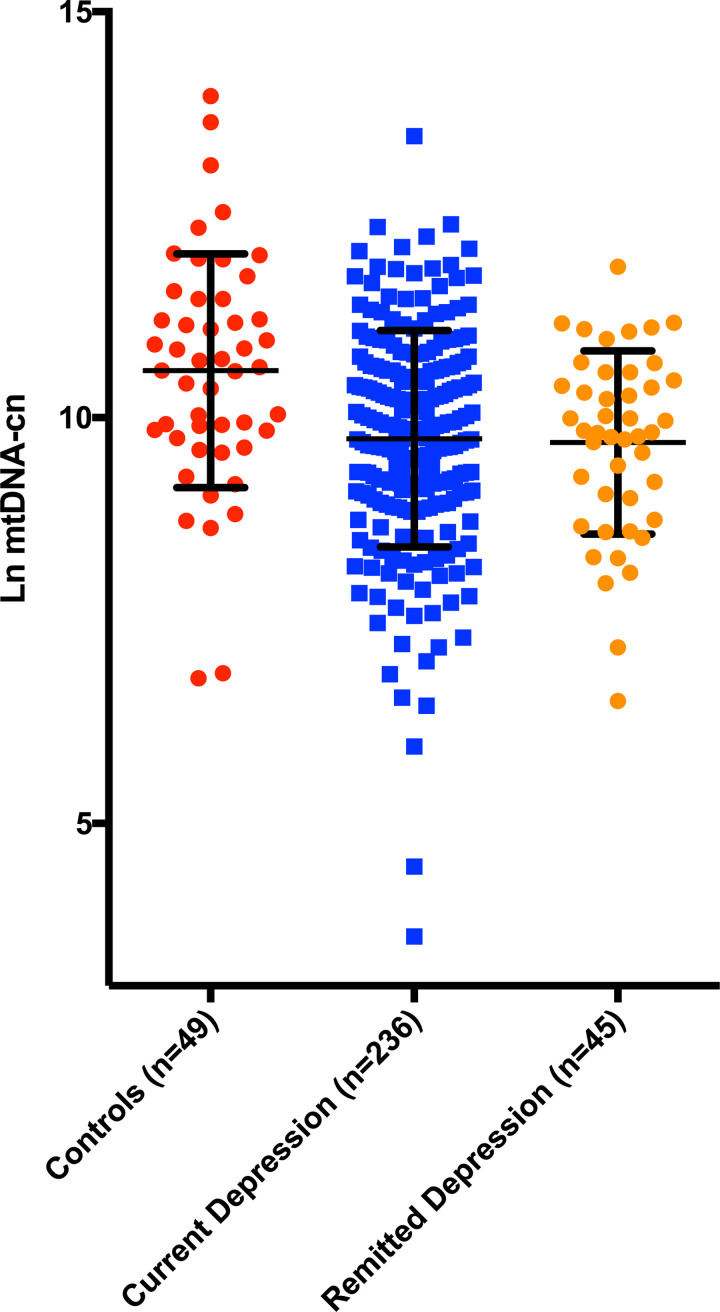
Fig 1. Log transformed ccf-mtDNA in controls, current depression and remitted depression.
Error bars represent mean, SD. The group effect was significant (F = 8.3, p<0.001, adjusted for age and sex). Post-hoc tests revealed that patients with current (p<0.001) and remitted (p = 0.002) depression had lower ccf-mtDNA compared to controls.

