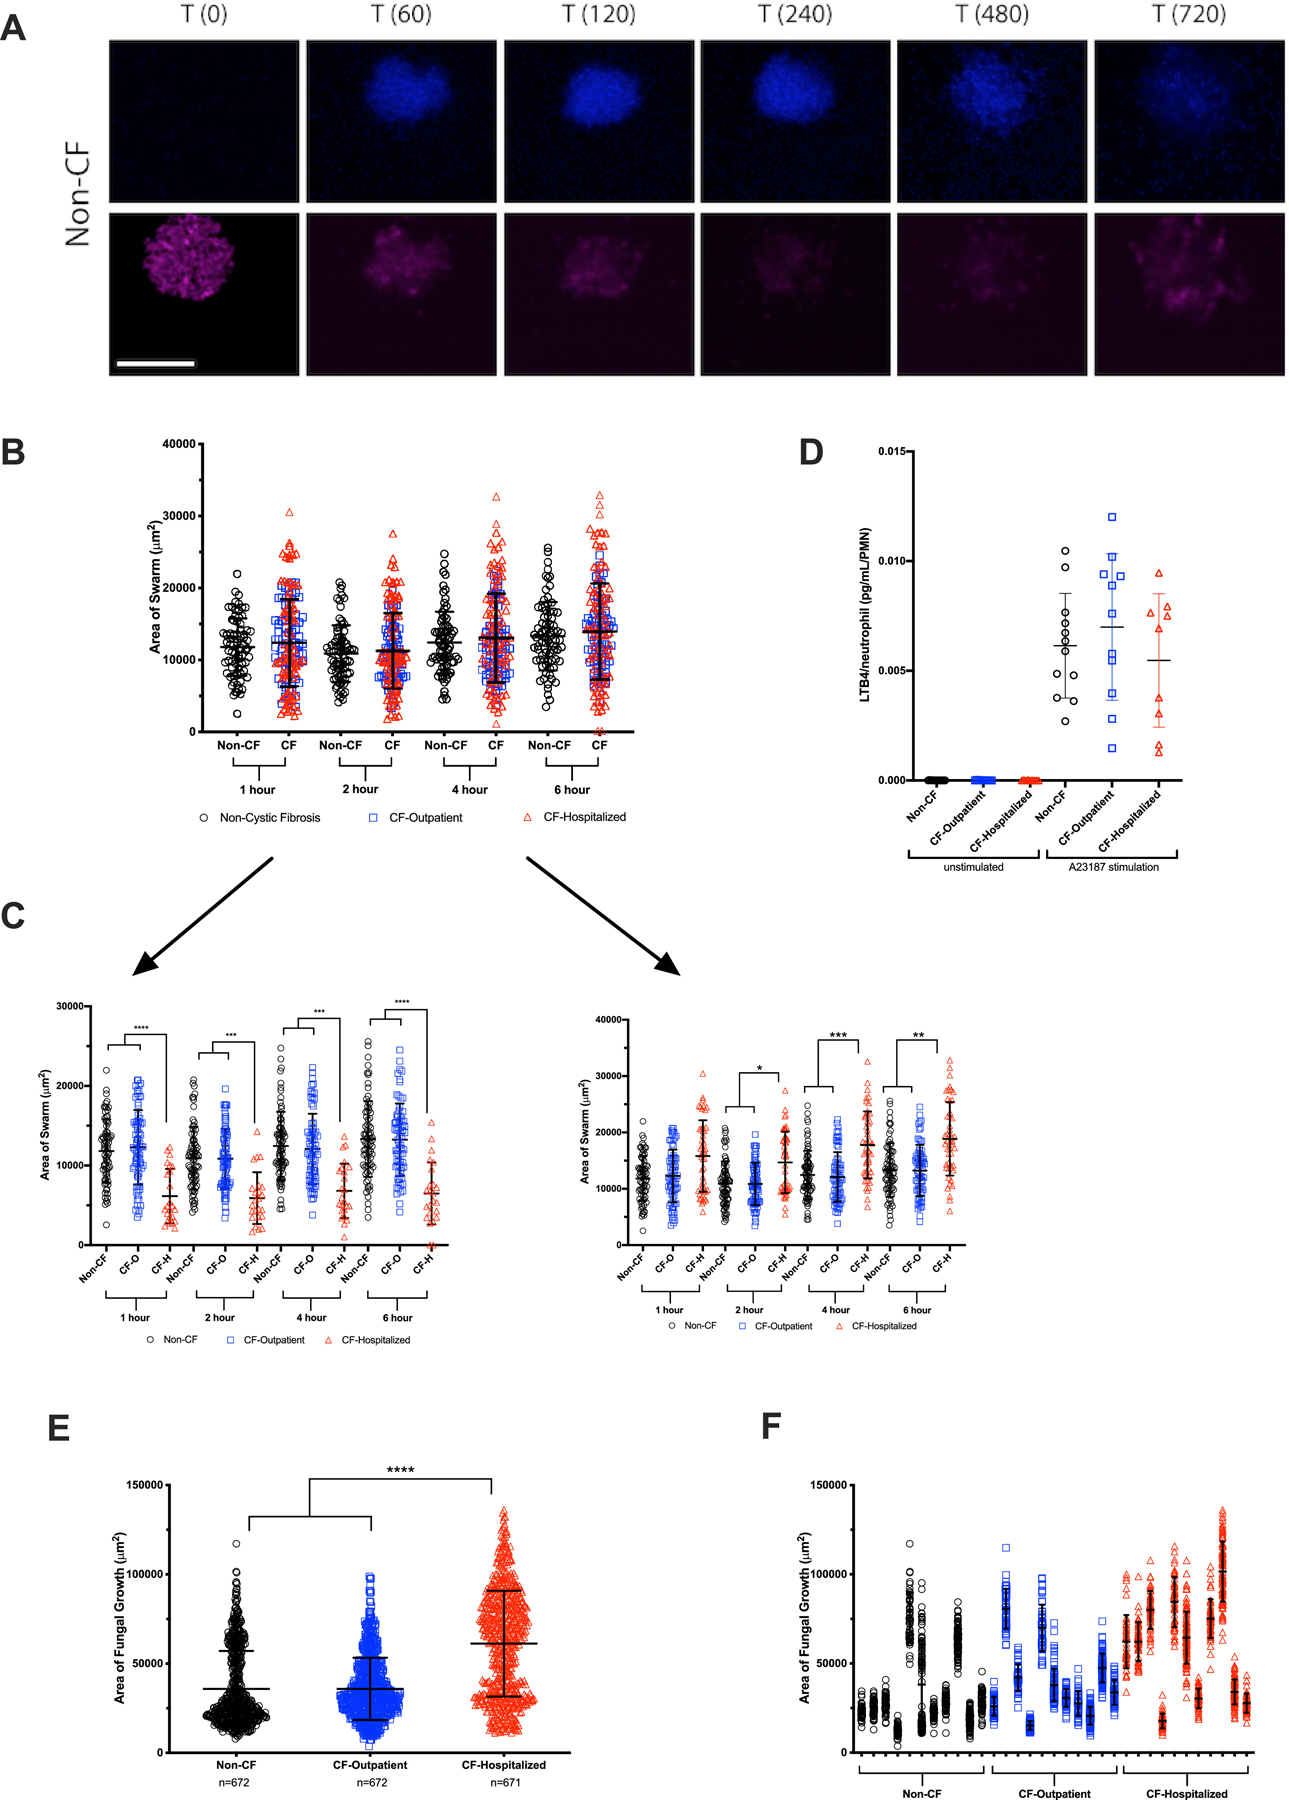
Figure 3. CF-hospitalized neutrophils display dysfunctional swarming dynamics and function:

Live C. albicans were patterned in 100 um diameter clusters on poly-l-lysine/Zetag arrays. Purified human neutrophils were stained with Hoechst, then added to the arrays to observe host-pathogen interactions, particularly swarming responses. (A) A panel of images showing a typical swarming response of neutrophils (Hoechst, blue) to a cluster of C. albicans (pink) is shown. (B) The area covered by individual neutrophil swarms was measured at specific timepoints for non-CF and CF-individuals. N=77 non-CF and 143 CF swarms. (C) The CF population was split into CF-outpatient and CF-hospitalized populations. CF-hospitalized displayed two aberrant swarming phenotypes, one with significantly smaller swarms than non-CF or CF-outpatient and the other with significantly larger swarms than non-CF or CF-outpatient. N=77 for non-CF and 71 for CF-outpatient swarms. N=24 for the “small” CF-hospitalized phenotype and N=48 for the CF-hospitalized “large” phenotype. (D) In parallel, neutrophils were isolated using the gelatin/RBC lysis method, then stimulated with DMSO or A23187. LTB4 was quantified by ELISA (E) The amount of C. albicans growth was quantified at 16 hours. CF-hospitalized neutrophils displayed a significant defect in restricting fungal growth compared to non-CF or CF-outpatient populations. (F) The fungal growth allowed by swarms from each donor is also displayed. *P<0.05, **P<0.01, ***P<0.001, ****P<0.0001 by Kruskal-Wallis with Dunn’s post-test. Scale bar represents 100 µm.
