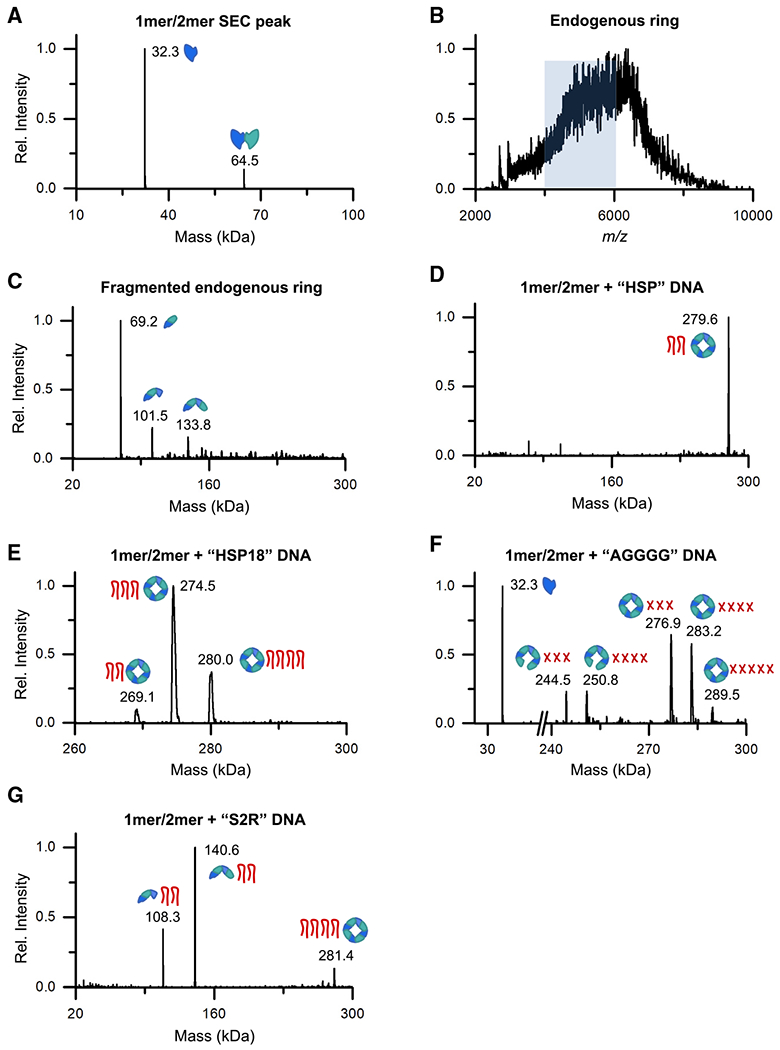
Figure 6. The VP40-nucleic acid complexes have well-defined stoichiometry.

(A) The deconvoluted mass spectrum of the VP40 monomer/dimer SEC fraction as measured by size-exclusion chromatography-nMS (SEC-nMS).
(B) The mass spectrum of the VP40 endogenous ring SEC fraction as measured by nMS, yielding a broad m/z signal that could not be resolved. The m/z range highlighted in blue was mass selected for dissociation in (C).
(C) The deconvoluted mass spectrum of the heterogeneous ring signal highlighted in (B) after mass-selection and fragmentation by surface-induced dissociation (SID).
(D-G) The deconvoluted mass spectra of the VP40 monomer/dimer after incubation with 3′ UTR-inspired DNA oligos (Table S2), as measured by SEC-nMS. For each detected complex, cartoons indicate the VP40 oligomeric state and the number of bound DNA oligos. In (F), each red X denotes a putative tetramolecular G-quadruplex of AGGGG oligos.
