
Figure 5.
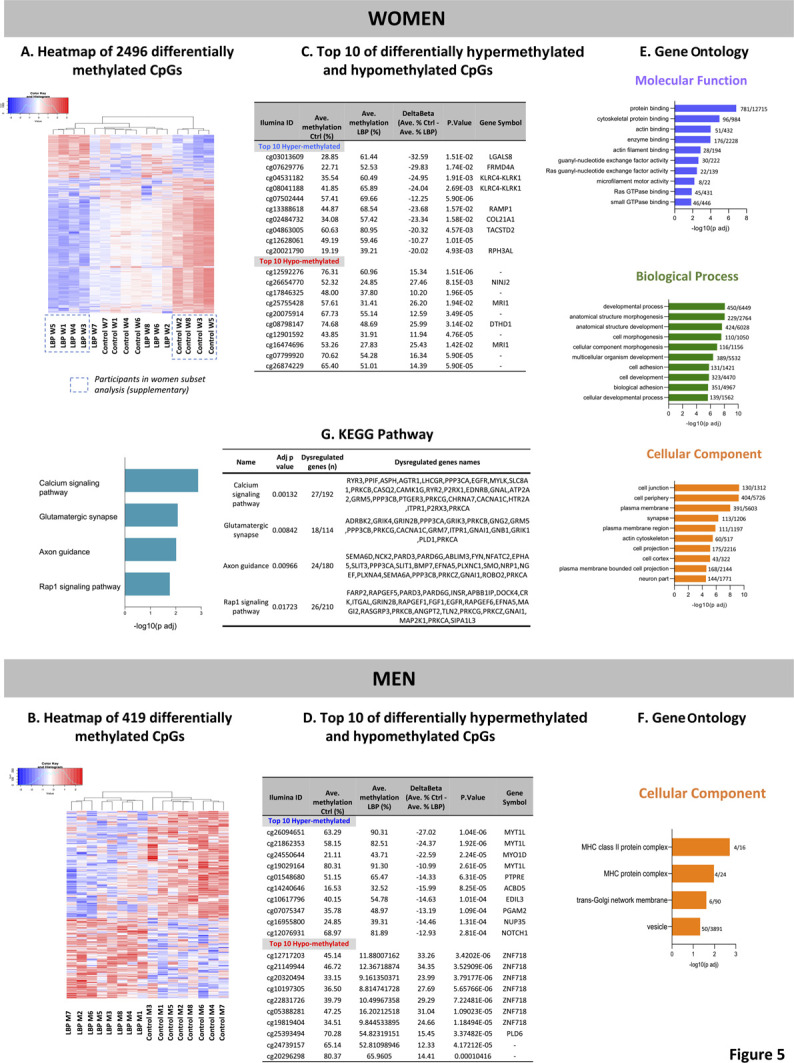
Heatmaps showing methylation signatures of (A) 2496 CpGs sites in women and (B) 419 in men. B values (after log2 transformation) are depicted using a red (hypermethylated in LBP) to blue (hypomethylated in LBP) methylation gradient. The top 10 differentially hypermethylated and hypomethylated CpGs are listed in both women (C) and men (D). Finally, the top 10 enriched Gene Ontology terms and KEGG pathways are shown in women (E and G) and men (F). Data are presented as enriched scores expressed as −log10 (adjusted P-value) with adj P-value <0.05. LBP, low back pain.