
Figure 13.
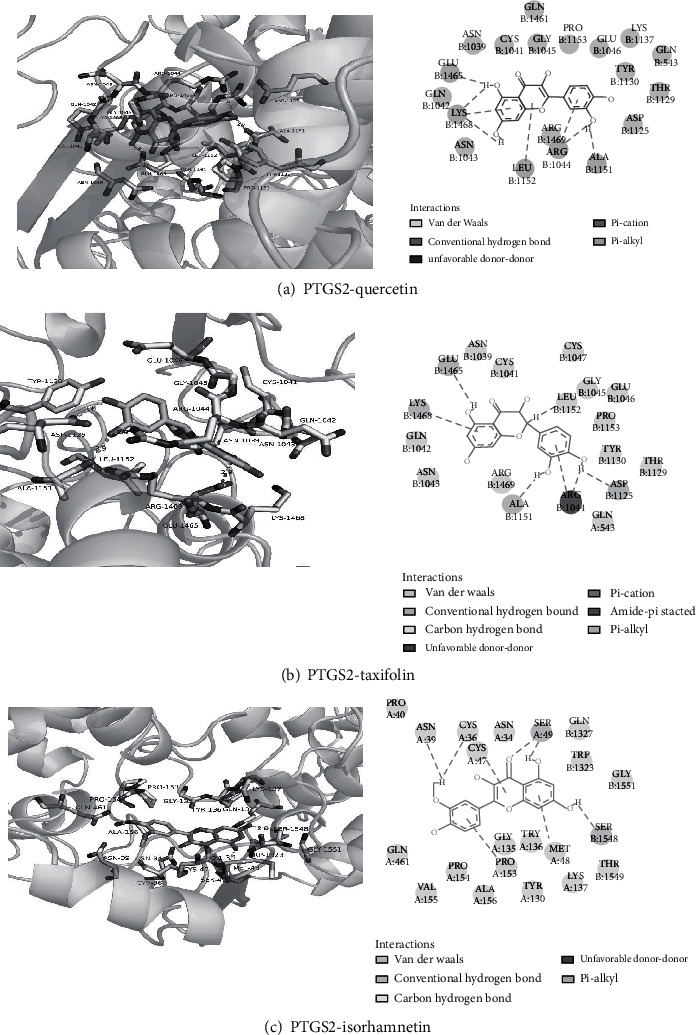
(a) 3D and 2D diagrams of PTGS2-quercetin interaction. (b) 3D and 2D diagrams of PTGS2- taxifolin interaction. (c) 3D and 2D diagrams of PTGS2-isorhamnetin interactions.
Official websites use .gov
A
.gov website belongs to an official
government organization in the United States.
Secure .gov websites use HTTPS
A lock (
) or https:// means you've safely
connected to the .gov website. Share sensitive
information only on official, secure websites.
(a) 3D and 2D diagrams of PTGS2-quercetin interaction. (b) 3D and 2D diagrams of PTGS2- taxifolin interaction. (c) 3D and 2D diagrams of PTGS2-isorhamnetin interactions.