Figure 6.

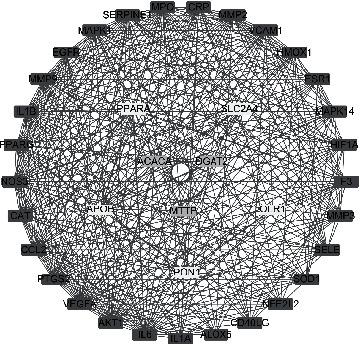
Clusters of the YCLW-hyperlipidemia network (red represents clusters 1, yellow represents clusters 2, and green represents clusters 3).

Clusters of the YCLW-hyperlipidemia network (red represents clusters 1, yellow represents clusters 2, and green represents clusters 3).