
Figure 7.
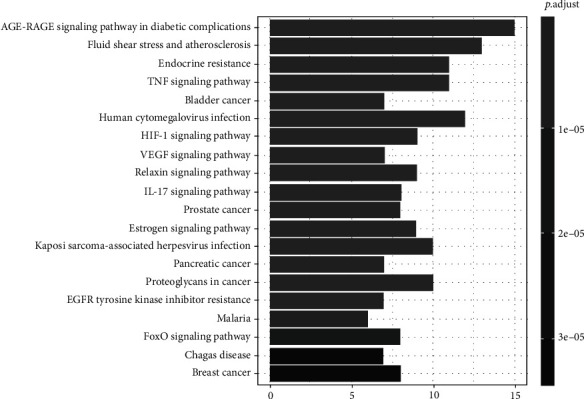
KEGG enrichment analysis. The length represents the number of target genes, and the color represents the level of significance.
Official websites use .gov
A
.gov website belongs to an official
government organization in the United States.
Secure .gov websites use HTTPS
A lock (
) or https:// means you've safely
connected to the .gov website. Share sensitive
information only on official, secure websites.
KEGG enrichment analysis. The length represents the number of target genes, and the color represents the level of significance.