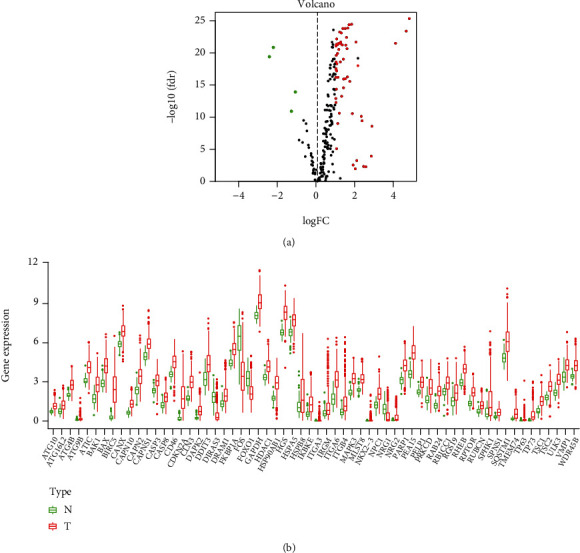
Figure 1.

Differentially expressed analysis of autophagy-correlated genes in the TCGA HCC cohort. (a) Volcano plot of the autophagy-related genes. Notes: TCGA: The Cancer Genome Atlas; HCC: hepatocellular carcinoma; red: upregulated genes; green: downregulated genes; black: nondifferentially expressed genes. (b) Expression of 62 differentially expressed autophagy-related genes in HCC patients and normal controls. Notes: HCC: hepatocellular carcinoma; red represents tumor samples, and the green represents normal controls.
