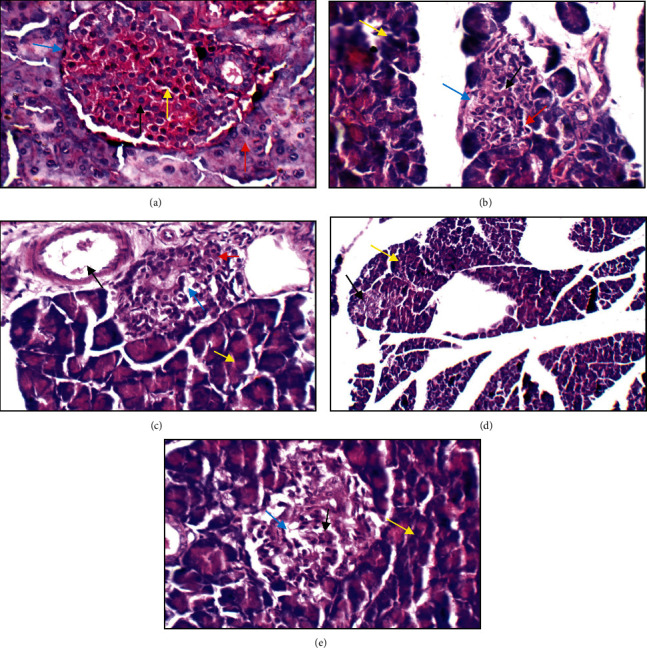
Figure 9.

Histopathological structure of the normal pancreas. (a) The normal pancreas showing average-sized normocellular islets with predominating beta cells (black arrow) and less frequently alpha cells in the periphery (blue arrow), average intervening blood capillaries (yellow arrow), and average exocrine areas (red arrow) (H&E ×400). (b) The diabetic pancreas showing relatively small-sized islets with apoptotic beta cells (black arrow), excess alpha cells (red arrow), average intervening blood capillaries (blue arrow), and average exocrine areas (yellow arrow) (H&E ×400). (c) The metformin-treated pancreas showing average islet with average beta cells (red arrow), mildly dilated intervening blood capillaries (blue arrow), average exocrine areas (yellow arrow), and mildly congested blood vessels (black arrow) (H&E ×400). (d) The insulin-treated group showing relatively small-sized pale-staining islets of Langerhans (black arrow) and average exocrine areas (yellow arrow) (H&E ×200). (e) Herb treatment showing hypocellular islets with scattered beta cells (black arrow) with mildly dilated intervening blood capillaries (blue arrow) and average exocrine areas (yellow arrow) (H&E ×400).
