
Figure 4.
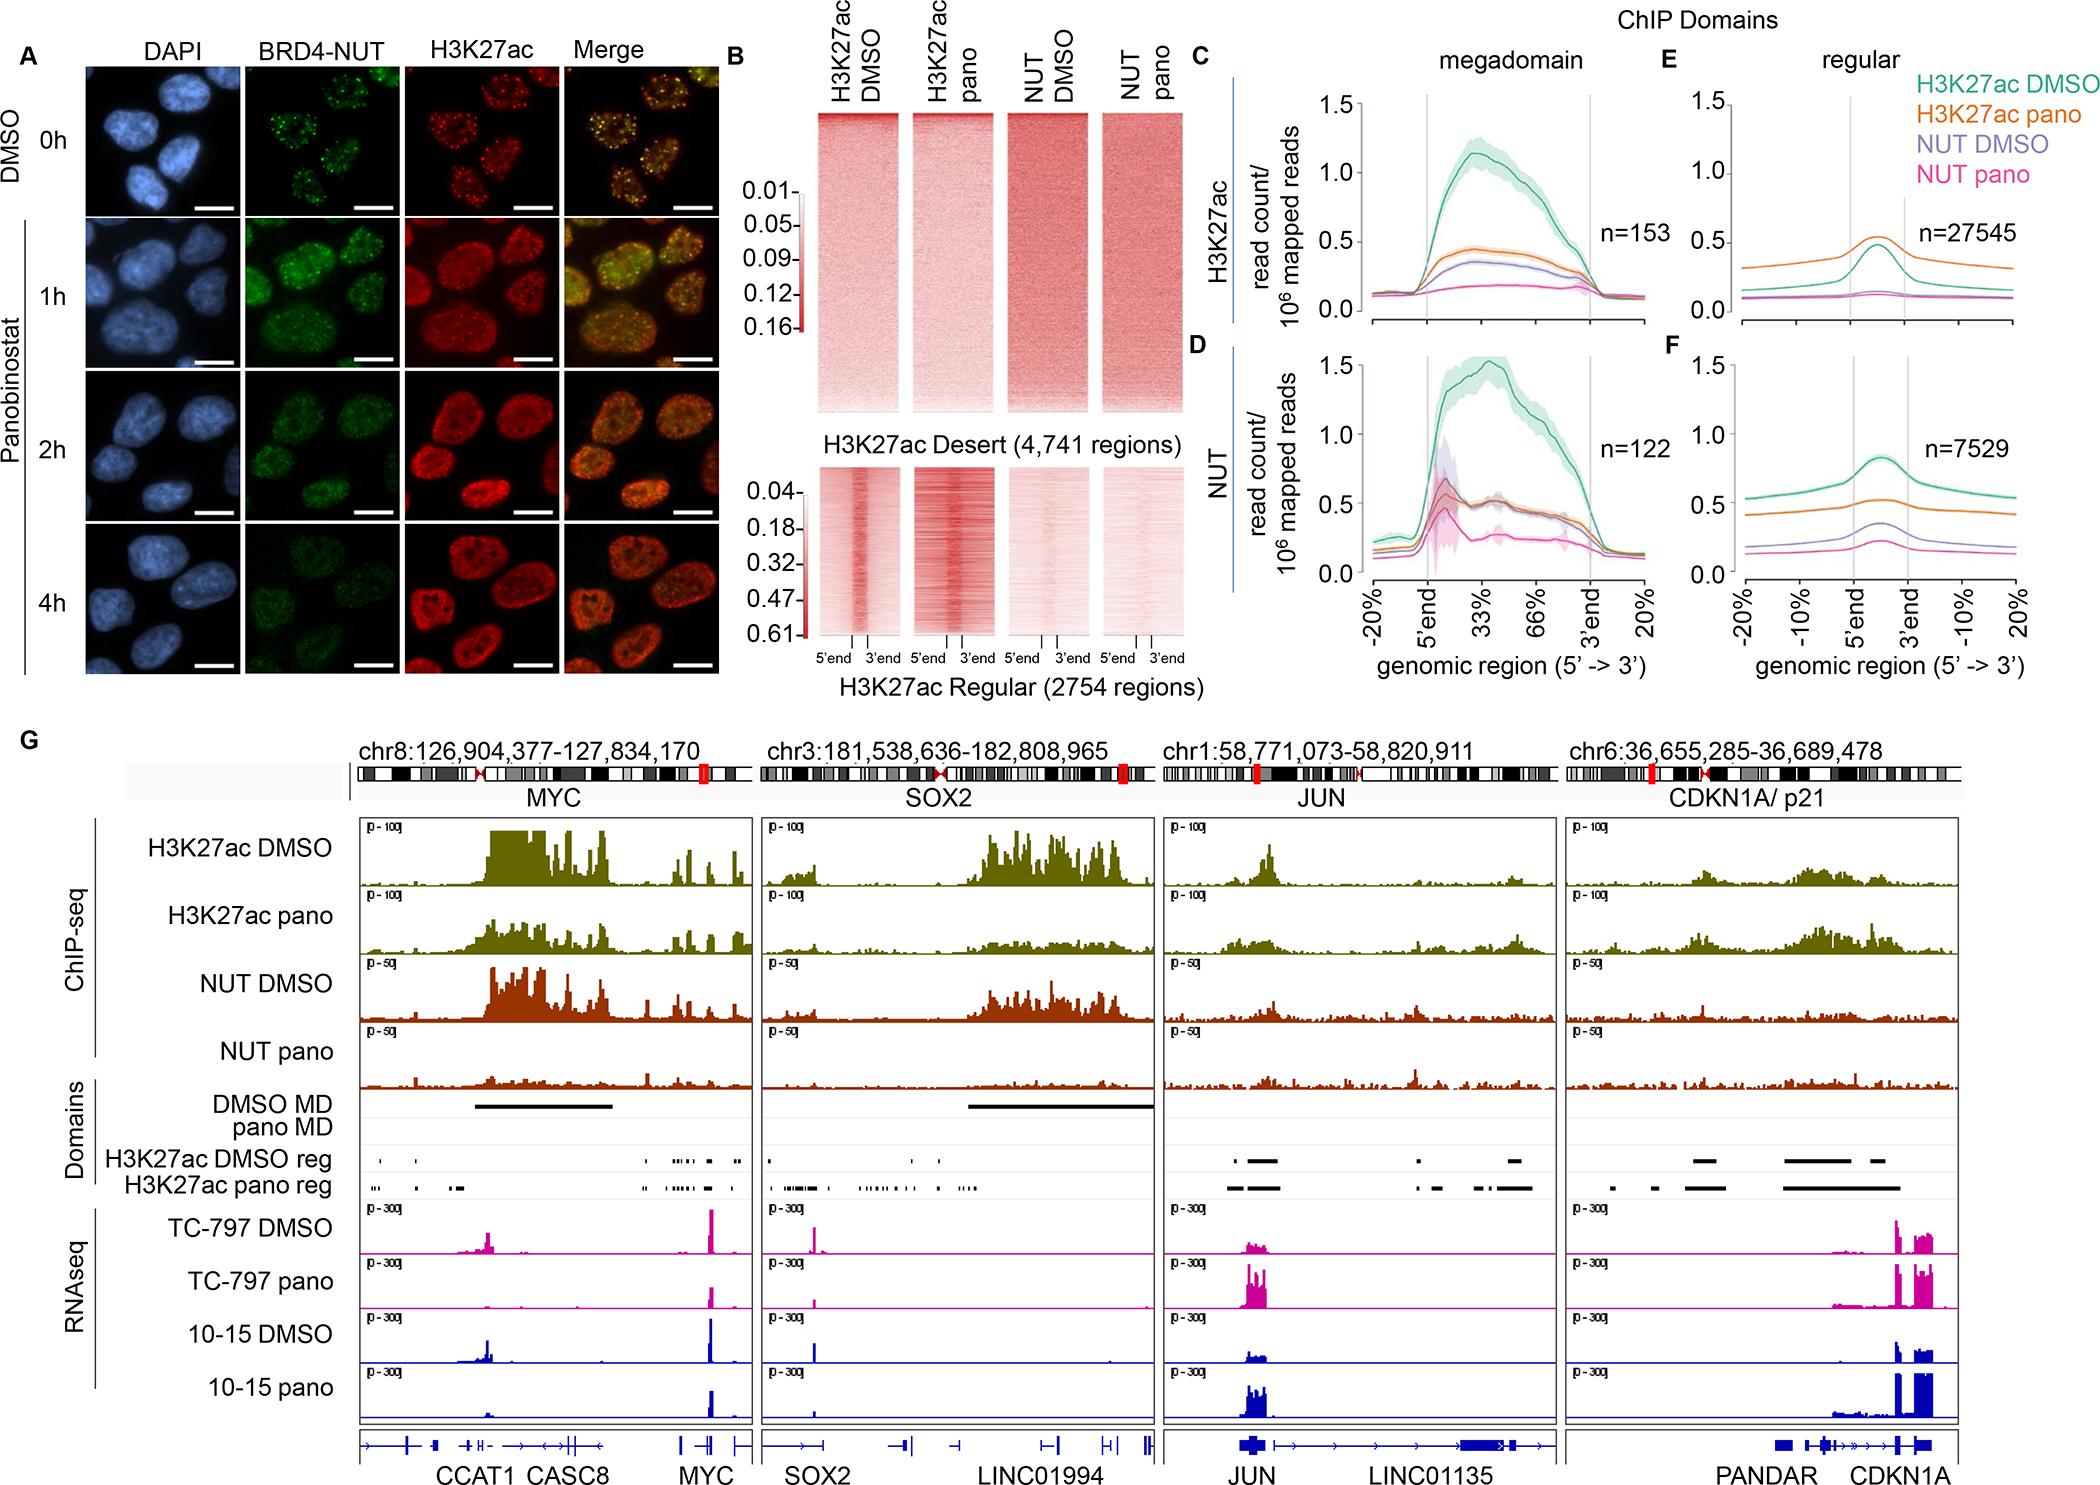
Panobinostat treatment induces redistribution of BRD4-NUT and H3K27ac in NC cells. A. Images of immunofluorescence showing BRD4-NUT (green) and H3K27ac (red) localization in TC-797 cells treated with 30 nM of panobinostat for 1, 2, or 4 h. No further changes were seen at 8h (not shown). Control cells were treated with DMSO for 4 h. Scale bar, 10μm. B. Heatmaps of ChIP-seq performed on TC-797 cells treated with panobinostat (30nM) or DMSO for 4h. Top, H3K27Ac ChIPseq signal heatmaps of 4,741 H3K27Ac desert regions. Bottom, heatmaps of randomly sampled H3K27Ac peaks (n=2,754, 10% of 27,545 peaks). C-F. ChIP-seq signal profiles of BRD4-NUT and H3K27ac in TC-797 cells treated with panobinostat or DMSO for 4h obtained from ChIP-seq data as in B. ChIP-seq signal profiles within megadomain regions and regular peak regions (“regular”) as indicated are shown. Megadomains are defined by the inflection point obtained from the H3K27ac superset of peaks in DMSO-treated cells, for which the cutoff is 55kb. Regular domains are defined as non-megadomain peaks for the indicated antibodies used for ChIP. Number of peaks used for each profile are indicated. C. Enrichment profile in H3K27ac-associated megadomains. D. Enrichment profile in NUT-associated megadomains identified using the 55kb cutoff. E. Enrichment profile in H3K27ac-associated regular domains. F. Enrichment profile in NUT-associated regular domains. G. Integrated genome browser (IGV) track of regions around MYC/SOX2 and JUN/CDKN1A loci as examples of megadomain (MD) and non-megadomain regions, respectively. BRD4-NUT and H3K27ac ChIP-seq signals are colored rust and green, respectively. Each track shown for ChIP-seq and RNA-seq is from replicate 1 of two replicates. Black bars indicate domains (megadomain or regular, as indicated) identified for the provided conditions. Megadomains indicated by the black bars include only overlapping H3K27ac and NUT-associated megadomains. Regular domains, also indicated by black bars, are shown only for H3K27ac peaks. RNA-seq tracks are colored pink and blue. pano, panobinostat; reg, regular domain.