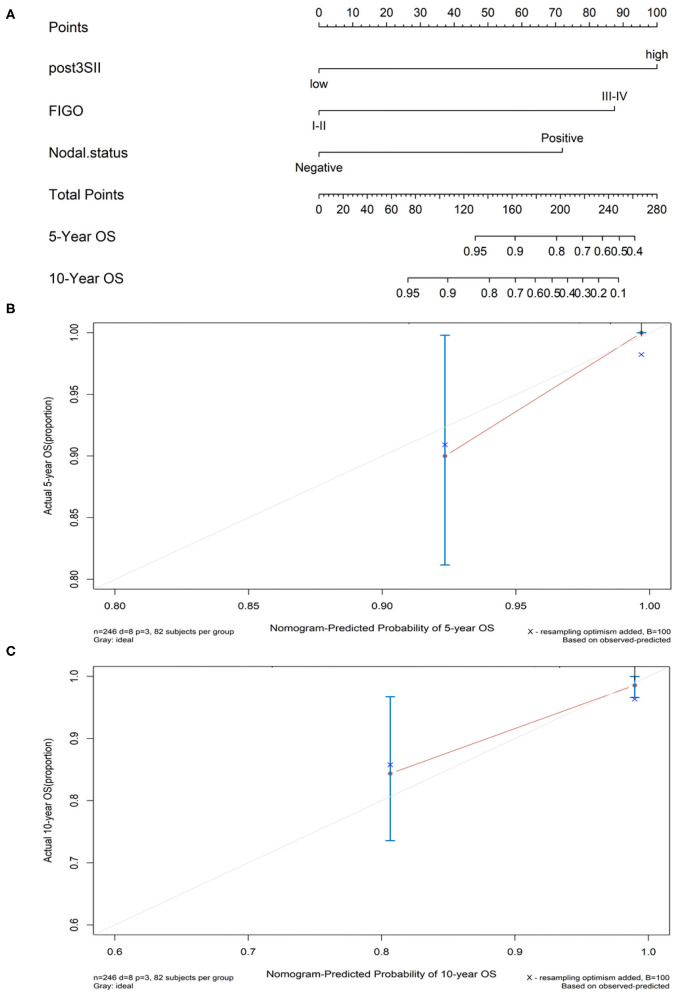
Figure 4.
(A) Nomogram model for estimating the rate of OS (5 or 10 years) for women with endometrial cancer. (B,C) Calibration curves of the nomograms. The calibration curves predicted OS at 5 years (B) and 10 years (C). Nomogram-predicted probability of OS was plotted on the x-axis and the observed OS was plotted on the y-axis.

