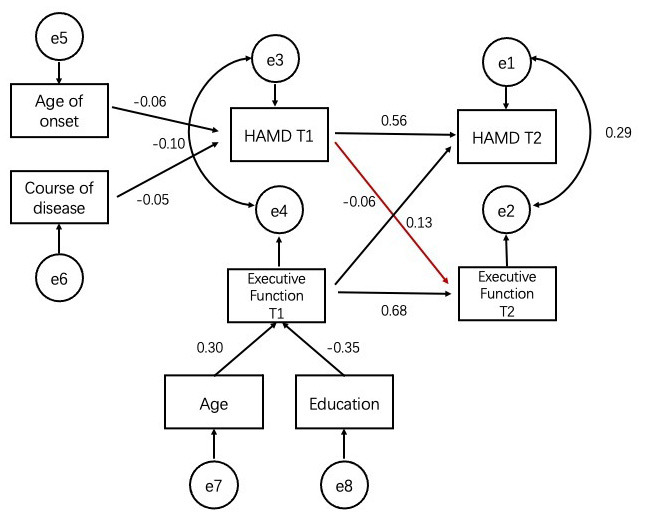
Figure 3.

Robust maximum-likelihood estimation of the cross-lagged model with age, education, age of onset and course of disease included as covariates. Figure in parentheses represent standard errors of the estimates. Straight line represent regression paths. Curve lines represent residual covariance. Executive function: scores of TMT-B. T1, time 1; T2, time 2.
