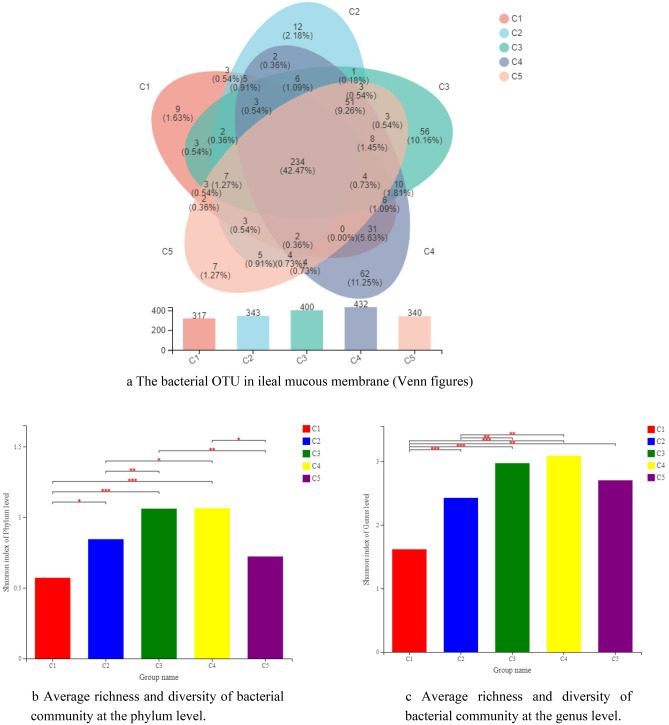
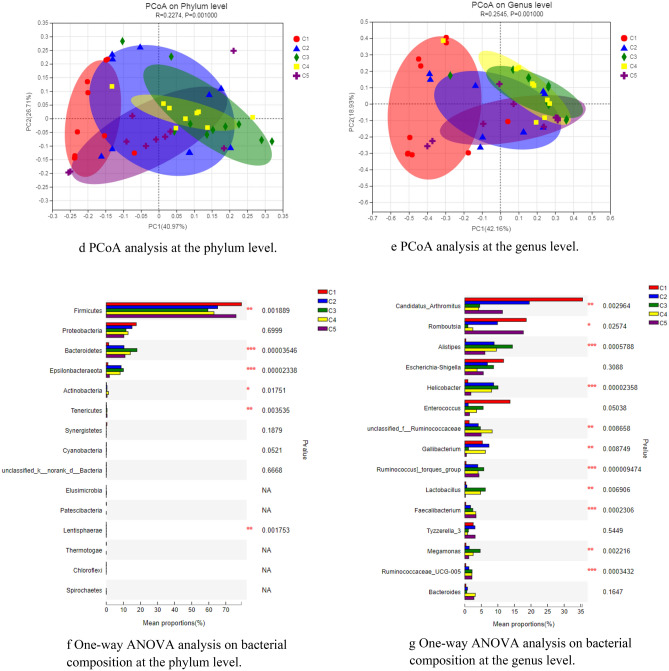
Figure 3.
Overall profile of bacterial composition in ileal mucous membrane. (a) The bacterial OTU in ileal mucous membrane (Venn figures). The number in the color circus or overlapped circus represented the owned OTU in one or more groups and correlated proportion. (b) Bacterial composition at the phylum level. (c) Bacterial composition at the phylum genus level. *in the same column means P < 0.05, **P < 0.01, and ***P < 0.001. (d,e) PCoA analysis of UniFrac distance metric of bacterial OTUs at the genus level (d) and phylum level (e). Figure was drawn by the ANOSIM of UniFrac distance metric. (f,g) One-way ANOVA analysis of bacterial composition at the phylum level (f) and phylum genus level (g). * n the same column means P < 0.05, **P < 0.01, and ***P < 0.001. The Microsoft Office Excel 2010 was used to as the stamp software.


