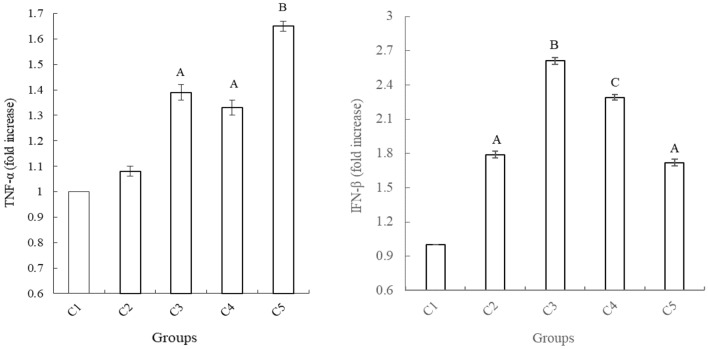
Figure 5.
The expression of cytokines in intestinal mucous cells. mRNA: glyceraldehyde phosphate dehydrogenase (GAPDH) internal control was used for statistical comparison. Values represented by vertical bars are means with standard errors. Significant differences from the control group were determined by one-way ANOVA followed by Duncan’s multiple comparison tests: superscript capital letters in the same color of column and in the same experimental duration mean P < 0.01. The Microsoft Office Excel 2010 was used to as the stamp software.

