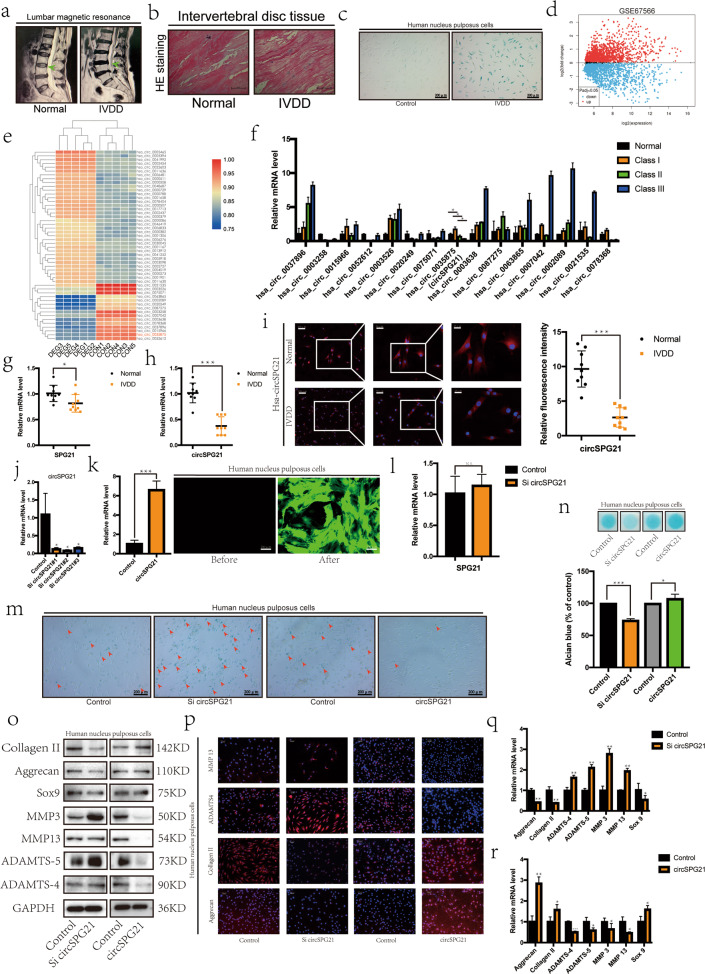
Fig. 1. circSPG21 regulates NPC extracellular matrix (ECM) metabolism.
a MRIs were compared between the normal and degenerative groups; n = 2 (two different donors). b HE staining was performed in the normal and degenerative group samples (scale bar, 100 μm); n = 2 (two different donors). c The degree of cell senescence was detected by β-galactosidase staining (scale bar, 200 μm); n = 2 (two different donors). d A volcano map was drawn according to the GEO database (GSE67566). e Heat map of all differentially expressed circular RNAs (circRNAs) in the degenerated and control disc tissues. f After screening 15 circRNAs, the relationship between circRNAs and the severity of degeneration was determined by real-time quantitative polymerase chain reaction (RT-qPCR), n = 4 (four different donors), *p < 0.05. g The expression of SPG21, as measured by RT-qPCR, in human degenerated tissue differed significantly from that in the control group; n = 6, *p < 0.05. Data are presented as the mean ± S.D., and the p values were determined by a two-tailed unpaired Student’s t-test. h The expression of circSPG21, as measured by RT-qPCR, in human degenerated tissue was significantly lower than that in control tissue; n = 6, ***p < 0.001. Data are presented as the mean ± S.D., and the p values were determined by a two-tailed unpaired Student’s t-test. i Left, the expression of circSPG21, as measured by FISH analysis, in human degenerated tissue was lower than that in control tissue. Representative images (scale bar, 25–100 μm) are displayed (two different donors). Right panel, the intensity of circSPG21 expression, as analyzed using fluorescence intensity, ***p < 0.001. Data are presented as the mean ± S.D., and the p values were determined by a two-tailed unpaired Student’s t-test. j Nucleus pulposus cells (NPCs) were transfected with circSPG21 siRNA# 1, 2, 3, or negative control siRNA (concentration 20 nm). The expression level of circSPG21, as determined using RT-qPCR, *p < 0.05. Data are presented as the mean ± S.D., and the p values were determined by a two-tailed unpaired Student’s t-test. k circSPG21 overexpression in NPCs after adenovirus infection with circSPG21. Left, circSPG21 was highly expressed in NPCs. Right, after virus infection, green fluorescence was observed under a fluorescence microscope (scale bar, 200 μm); ***p < 0.001. Data are presented as the mean ± S.D., and the p values were determined by a two-tailed unpaired Student’s t-test. l Expression of SPG21, as detected by RT-qPCR, after transfection with si-circSPG21. Data are presented as the mean ± S.D., and the p values were determined by a two-tailed unpaired Student’s t-test. m β-Galactosidase staining was performed to evaluate cell aging (scale bar, 200 μm). n Alcian staining was performed to evaluate the extracellular matrix; *p < 0.05, **p < 0.01. Data are presented as the mean ± S.D., and the p values were determined by a two-tailed unpaired Student’s t-test. o Expression of proteins (collagen II, aggrecan, SRY-box transcription factor 9 (SOX9), matrix metallopeptidase 3 (MMP3), MMP13, ADAM metallopeptidase with thrombospondin type 1 motif 4 (ADAMTS4), and ADAMTS5), as determined by western blotting. p Expression of collagen II, aggrecan, ADAMTS4, and MMP13, as determined by immunofluorescence (IF), compared according to the fluorescence intensity (Scale bar, 100 μm). Expression of genes after circSPG21 knockdown (q) or overexpression (r), as measured by RT-qPCR; *p < 0.05, **p < 0.01. Data are presented as the mean ± S.D., and the p values were determined by a two-tailed unpaired Student’s t-test.

