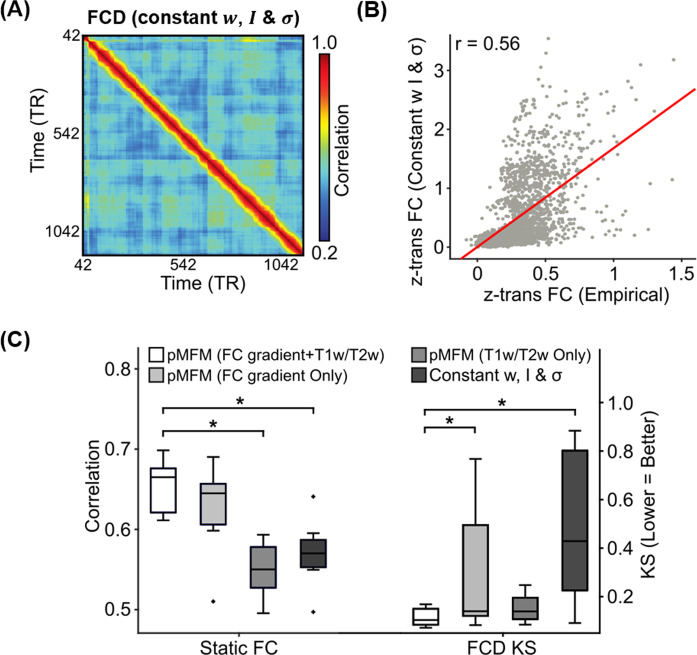
Fig. 3. Importance of multiple spatial gradients for generating realistic static functional connectivity (FC) and functional connectivity dynamics (FCD).
A Simulated FCD from a mean-field model (MFM) optimized using the same algorithm as pMFM, but with model parameters constrained to be the same across cortical regions. B Agreement between empirically observed and simulated static FC from MFM optimized using the same algorithm as pMFM, but with model parameters constrained to be the same across cortical regions. C Agreement (Pearson’s correlation) between simulated and empirically observed static FC, as well as disagreement (KS distance) between simulated and empirically observed FCD across different conditions in the test set. Each boxplot comprises 10 correlation values (left) or 10 KS statistic (right) based on the 10 best candidate sets from the validation set. The boxes show the inter-quartile range (IQR) and the median. Whiskers indicate 1.5 IQR. Black crosses represent outliers. The pMFM utilizing both anatomical and functional gradients (FC gradient and T1w/T2w spatial maps) performed the best, suggesting that T1w/T2w and FC gradient provided complementary contributions. * indicates statistical significance after correcting for multiple comparisons with a false discovery rate (FDR) of q < 0.05. All p values are reported in Supplementary Table S1. Source data are provided as a Source Data file.

