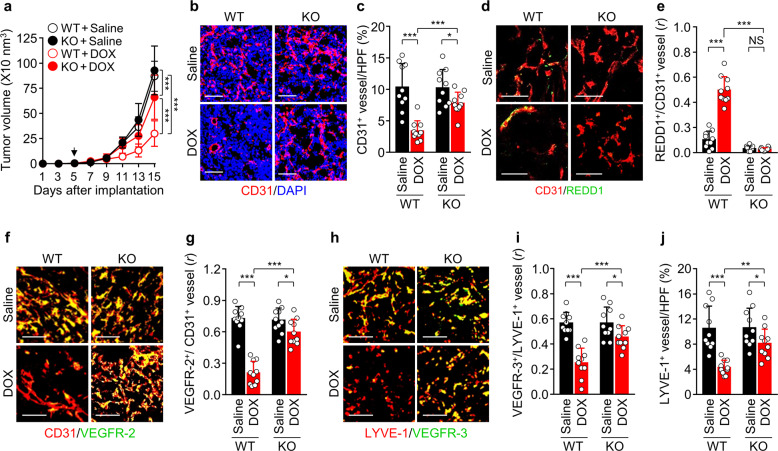
Fig. 5. LDMC with DOX inhibits tumor growth, angiogenesis, and lymphangiogenesis in B16F1 tumor-bearing WT but not Redd1−/− mice.
a Comparison of tumor growth in the WT and Redd1−/− mice metronomically treated with saline or DOX (n = 10 per group). The arrow indicates the start of DPX treatment. b Representative images of tumor sections showing CD31+ blood vessels and DAPI-stained nuclei. Scale bar, 100 μm. c Quantification of CD31+ blood vessel density per high-power field (HPF) (n = 10). d Representative images of tumor sections showing CD31+ blood vessels and REDD1 expression. Scale bar, 50 μm. e Quantification of their colocalization (n = 10). f Representative images of tumor sections showing CD31+ vessels and VEGFR-2 expression. Scale bar, 100 μm. g Quantification of their colocalization (n = 10). h Representative images of tumor sections showing LYVE-1+ lymphatic vessels and VEGFR-3 expression. Scale bar, 100 μm. i Quantification of colocalization of VEGFR-3 and LYVE-1 (n = 10). j Quantification of LYVE-1+ lymphatic vessel density (n = 10). Data are presented as the mean ± SD. *P < 0.05, **P < 0.01, ***P < 0.001; NS, not significant. r, Pearson’s correlation coefficient.

