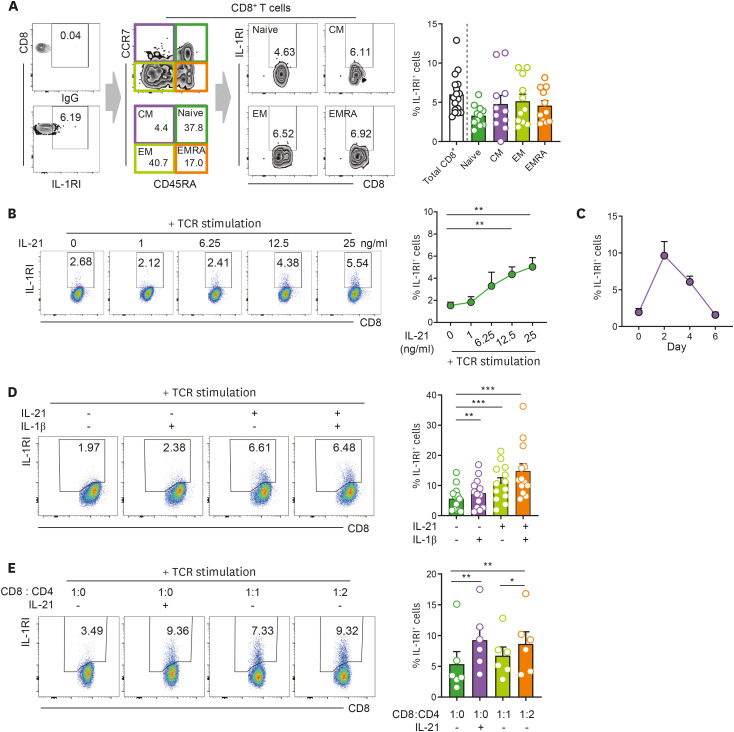
Figure 1. IL-21 induces the expression of IL-1RI on TCR-stimulated CD8+ T cells. (A) Representative flow cytometric plot of IL-1RI expression on total CD8+ T cells, naive (CD45RA+CCR7+), CM (CD45RA−CCR7+), EM (CD45RA−CCR7−), and EMRA (CD45RA+CCR7−) cell subsets from healthy controls. Frequency (%) of IL-1RI+ cells in indicated T-cell populations. (B) Representative flow cytometric plot and the frequency (%) of IL-1RI expression on TCR-stimulated CD8+ T cells in the presence of the indicated concentration of rhIL-21. (C) Time kinetics of IL-21-induced IL-1RI expression on TCR-stimulated CD8+ T cells. (D) Representative flow cytometric plot and frequency (%) of IL-1RI on TCR-stimulated CD8+ T cells treated with rhIL-21 (25 ng/ml) and/or rhIL-1β (25 ng/ml) at day 2 post-stimulation. (E) Co-culture of purified human CD4+ and CD8+ T cells in the presence of TCR stimulation. Purified cells were seeded at the indicated ratio and cultured with anti-CD3/28 coated microbeads in the absence or presence of rhIL-21 (50 ng/ml) for 2 days. Bar graphs show the mean±SEM. The statistical significance was measured by 2-tailed paired t-test.
CM, central memory; EM, effector memory; EMRA, CD45RA+ effector memory.
*p<0.05, **p<0.01, ***p<0.005.

