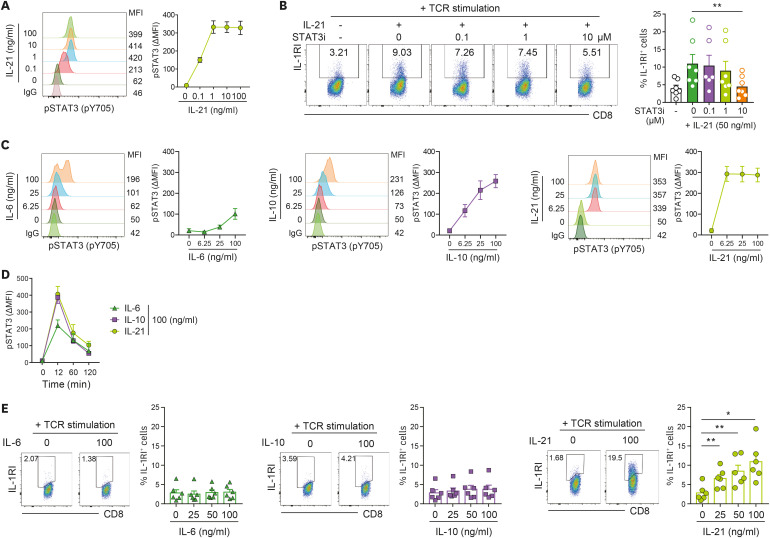
Figure 2. STAT3 activation is necessary, but not sufficient, for induction of IL-1RI on TCR-stimulated CD8+ T cells. (A) Phosphorylation of STAT3 (pY705) in IL-21-stimulated CD8+ T cells. The cells were stimulated with the indicated concentration of rhIL-21 for 12 min. A phospho-protein specific flow cytometric analysis (Phosflow assay) was used to detect pSTAT3. (B) Representative flow cytometric plot and the frequency (%) of IL-1RI expression on TCR-stimulated CD8+ T cells. Cells were treated with rhIL-21 (50 ng/ml) in the presence of the indicated concentrations of the 5,15-DPP STAT3i. (C) Flow cytometric analysis of pSTAT3 (pY705) in IL-6 (100 ng/ml), IL-10 (100 ng/ml), or IL-21 (100 ng/ml)-stimulated CD8+ T cells. Cells were stimulated with the indicated concentration of cytokines for 12 min (n=4). (D) Kinetics of STAT3 phosphorylation in CD8+ T cells treated with IL-6, IL-10, or IL-21 (n=4). (E) Representative flow cytometric plot and the frequency (%) of IL-1RI expression on TCR-stimulated CD8+ T cells treated with exogenous IL-6, IL-10, or IL-21 for 2 days. Bar graphs and line graphs show the mean±SEM. The statistical significance was measured by 2-tailed paired t-test.
MFI, mean fluorescence intensity.
*p<0.05, **p<0.01.

