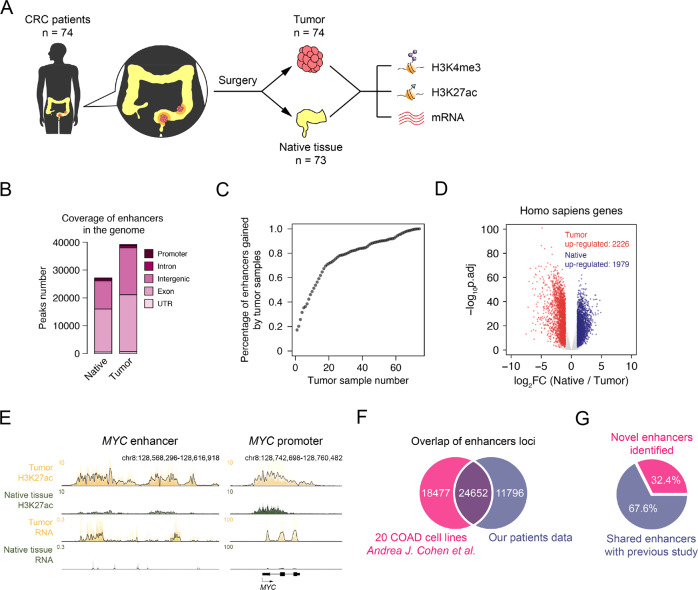
Fig. 1. The annotation of active enhancers in CRC patient tissues.
A Experimental workflow for studying the enhancer landscapes of tumor and native tissues from CRC patients. B Genomic distribution of enhancer elements in tumor and native tissues from CRC patients. C Saturation analysis showing the percentage of newly gained enhancers comparing with total significant enhancers along with an increasing number of the tumor samples. D Fold change (FC) and p.adj of human gene expression comparing tumor and native tissues. Red dots represent tumor up-regulated genes, blue dots for native tissue up-regulated genes, and grey dots for genes not changed. E Normalized ChIP-seq and RNA-seq Meta tracks showing H3K27ac and mRNA signal on MYC promoter and enhancer loci. F Overlap of enhancer loci between our patient data and 20 COAD cell lines (GSE77737, Andrea J. Cohen et al.). G Percentage of novel enhancers in CRC identified in our study.

