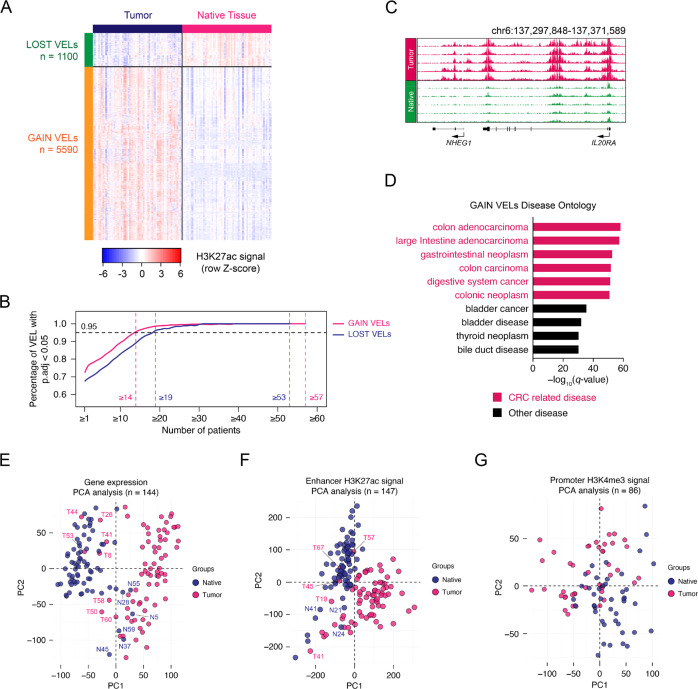
Fig. 2. Identification of variant enhancer loci in CRC.
A Relative H3K27ac signals of lost and gain VELs in all tumor and native tissues. B The required recurrence for gain and lost VELs meeting statistical significance (p.adj <0.05). The two vertical dashed lines at left highlights the recurrence of gain and lost VELs when achieve the cut-off (0.95, black dashed line) of significant percentage, and the two lines at right highlights the highest recurrence in tumor or native tissue of gain and lost VELs, respectively. For gain VELs, when recurrence reach to 14, the percentage of significant VELs is 95.635%; for lost VELs, when recurrence reaches to 19, the percentage of significant VELs is 96.273. p.adj indicates the BH adjusted t-test p-value. A two-sided test was utilized here. C Representative H3K27ac tracks of gain VEL on IL20RA loci. D The human disease ontology in which gain VELs participated detected by GREAT software (version 3.0.0). The red bars represent CRC-related diseases and the black bars represent other diseases. E–G PCA analyses to classify tumor and native tissues using gene expression (E), all significant enhancers (F), and promoters (G) information identified using our patient RNA-seq and ChIP-seq data.

