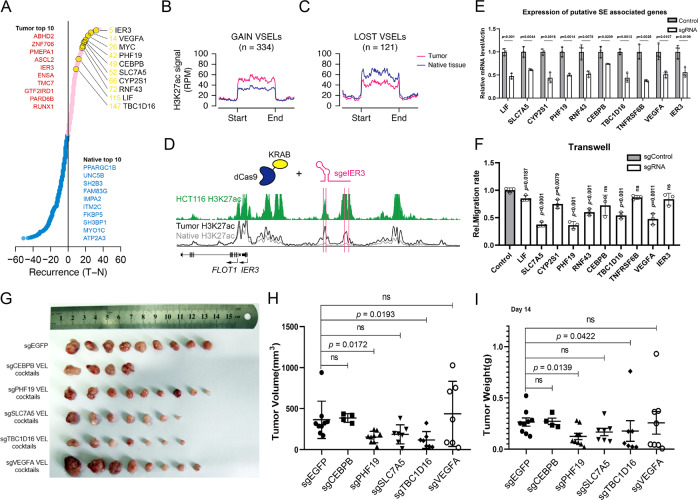
Fig. 4. Functions of tumor-specific super enhancers in CRC.
A The genes associated with top super-enhancers (SEs) ranked by recurrence. Red dots represent tumor-specific SE genes and blue dots represent native tissue-specific SE genes. Top 10 tumor and native tissue-specific genes were listed. B–C The average H3K27ac signal (RPM) at the regions of gain VSELs (B) and lost VSELs (C) in tumor and native tissues. D Meta normalized H3K27ac tracks at IER3 gene loci. The green track on the top represents the H3K27ac signal in HCT116, and the black and grey lines at the bottom represent the average signal of tumor and native tissues, respectively. The pink lines indicate the target positions of dCas9-KRAB sgRNAs. E Bar plot showing the relative mRNA level of LIF, SLC7A5, CYP2S1, PHF19, RNF43, CEBPB, TBC1D16, TNFRSF6B, VEGFA, and IER3 in control and sgRNA groups (n = 3). A sgRNA control targeting EGFP was used as a control in the following experiments. *p < 0.05. F Transwell assays for HCT116 cell lines stably transfected with dCas9-KRAB sgRNAs of the enhancers mentioned in Fig. 5E (n = 3). G–I Xenograft experiments in nude mice were performed with HCT116 stable cells expressing the indicated sgRNAs. The tumors were pictured (G), and their volume and weight were shown (H&I). n = 9 for all groups. Data are presented as mean values ± SEM. Statistical analysis was performed using a two-sided Student t test. p value was labelled on the corresponding items.

