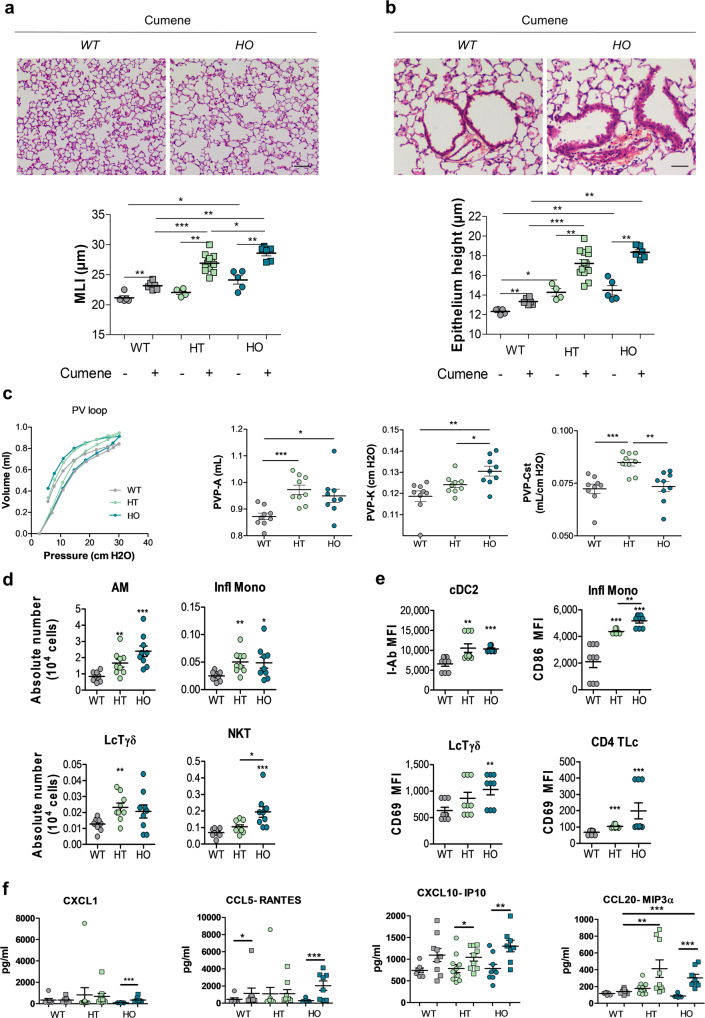
Fig. 3. α5SNP amplified oxidative stress-induced lung inflammation and respiratory dysfunction.
Lung histology and respiratory function measurement of 14–18 wo mice, WT (gray), HT (green) or HO (blue) treated with cumene hydroperoxide (squares) or PBS (circles) (a–c). a Quantification of MLI and epithelial height at bronchiolo-alveolar junctions b in WT (n = 5), WT treated with cumene (n = 6), HT (n = 4), HT treated with cumene (n = 13), HO (n = 5), HO treated with cumene (n = 6) mice. Scale bars: a = 100 μm, b = 50 µm. c PV loop curves (n = 16 for each group), A (estimate of inspiratory capacity), K (shape constant) and static compliance (Cst). A and K parameters and Cst are extracted from the Salazar-Knowles equation52 and expressed as mean ± SEM (n = 9 mice for each group). d, e Quantification of lung inflammation in BALF by cytometry (n = 9 mice per group). d Number of alveolar macrophages (AM), inflammatory monocytes (Infl Mono), Tγδ lymphocytes (LcTγδ) and natural Killer cells (NKT). e Activation of dendritic cells (cDC2, I-Ab MFI), inflammatory monocytes (CD86 MFI), Tγδ lymphocytes, and CD4+ T cells (CD69 MFI). f Expression of cytokines CXCL1, CCL5, CXCL10, and CCL20 in BALF from WT treated with PBS (circles, n = 7) or cumene (squares, n = 9), HT treated with PBS (circles, n = 11) or cumene (squares, n = 9) and HO treated with PBS (circles, n = 9) or cumene (squares, n = 8). a–f Data are expressed as mean ± SEM. For statistical analyses, values are compared to the appropriate non-treated control (a, b) or to WT mice (c–f). *p < 0.05; **p < 0.01; ***p < 0.001 (Mann–Whitney two-sided test).

